Discrete Case Study PIR Exhibits
Discrete Book Case Study Results
Exhibits by Chapter
- Chapter 2: Basic loss statistics (A-C)
- Chapter 4: VaR, TVaR and EPD statistics (D, E)
- Chapter 7: Portfolio pricing, used for calibration (F, G)
- Chapter 9: Classical portfolio and stand-alone pricing (H-L)
- Chapter 11: Modern portfolio and stand-alone pricing (M-Q)
- Chapter 13: Classical allocations (R, S)
- Chapter 15: Modern allocations (T-Y)
See Section 1.28 for more details.
Table A
PIR Chapter 2, Tables 2.3, 2.5, 2.6, 2.7, Estimated mean, CV, skewness and kurtosis by line and in total, gross and net.
| statistic | Gross: X1 | Gross: X2 | Gross: Total | Net: X1 | Net: X2 | Net: Total |
|---|---|---|---|---|---|---|
| Mean | 4.5 | 22.75 | 27.25 | 4.5 | 5.25 | 9.75 |
| CV | 1.012 | 1.707 | 1.435 | 1.012 | 1.624 | 0.991 |
| Skewness | 0.071 | 1.154 | 1.131 | 0.071 | 1.147 | 0.794 |
| Kurtosis | -1.905 | -0.667 | -0.649 | -1.905 | -0.673 | -0.501 |
Figure B
PIR Chapter 2, Figures 2.2, 2.4, 2.6, Gross and net densities on a linear and log scale.
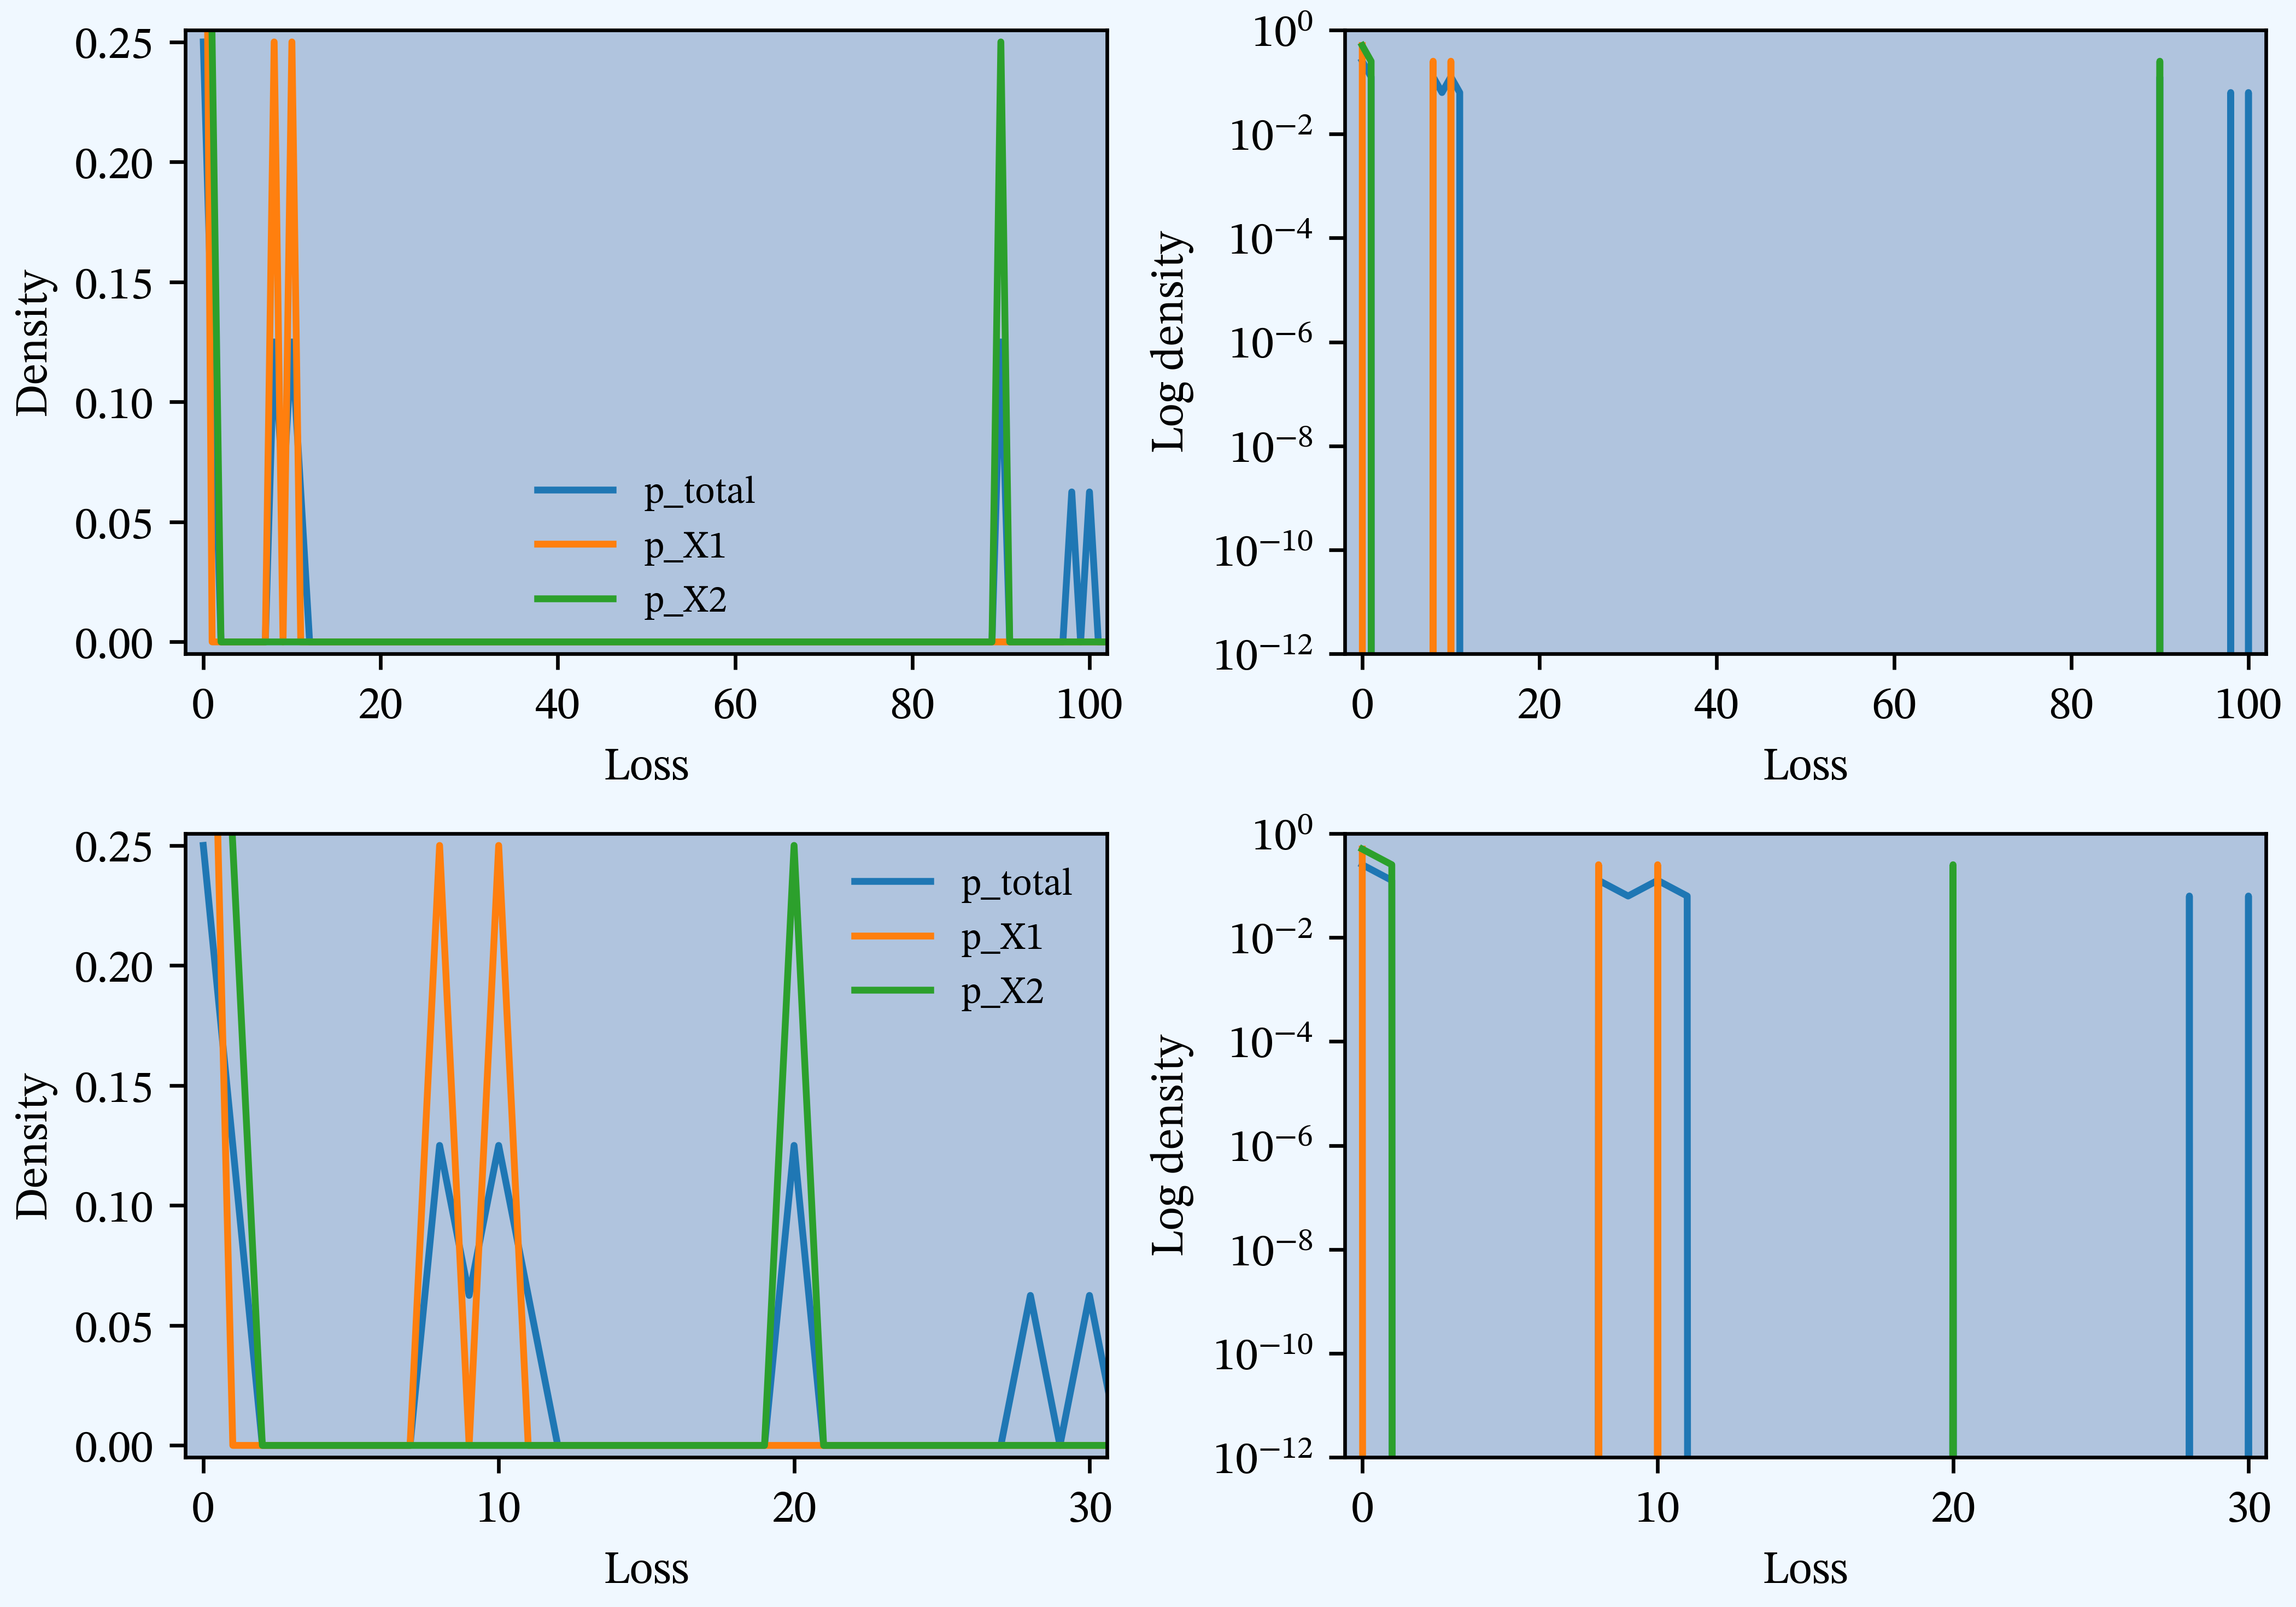
Figure C
PIR Chapter 2, Figures 2.3, 2.5, 2.7, Bivariate densities: gross and net with gross sample.
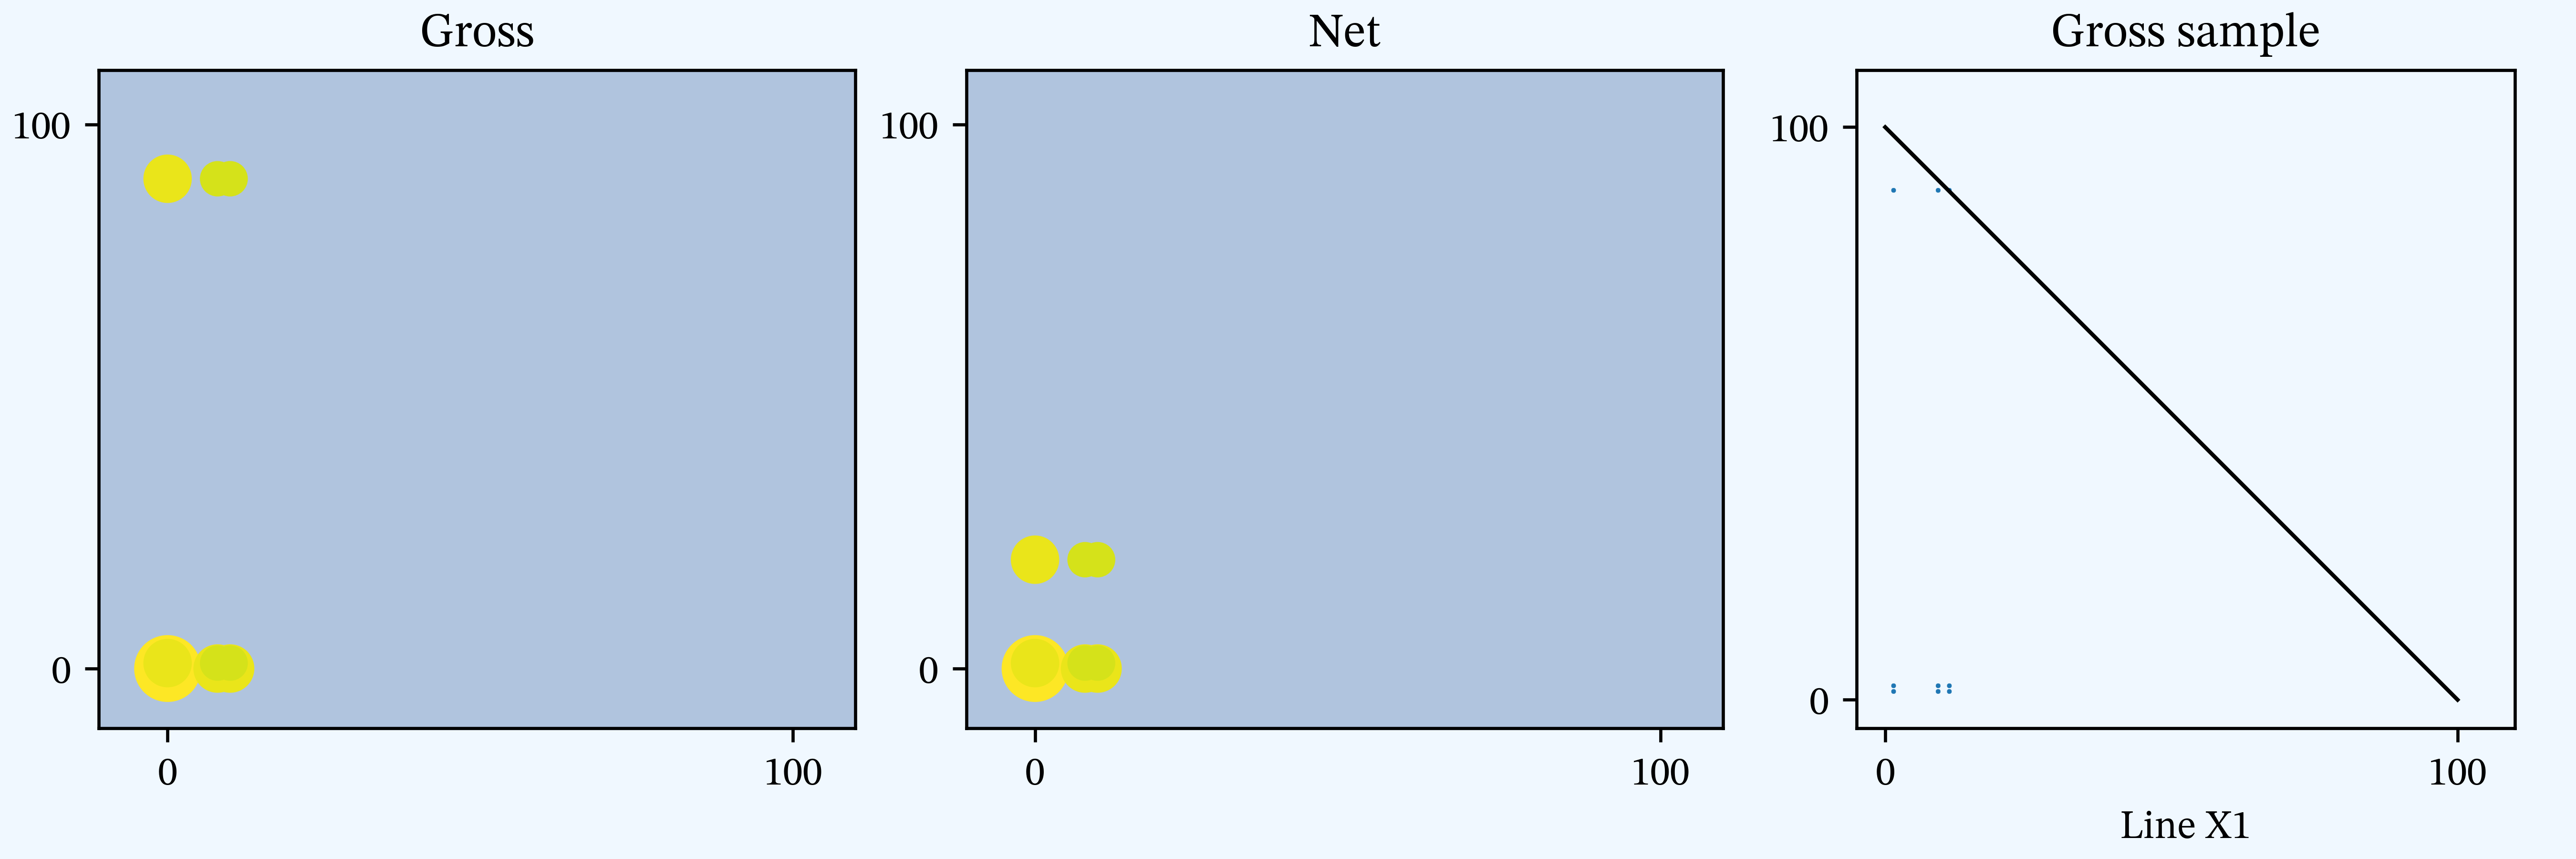
Figure D
PIR Chapter 4, Figures 4.9, 4.10, 4.11, 4.12, TVaR, and VaR for unlimited and limited variables, gross and net.
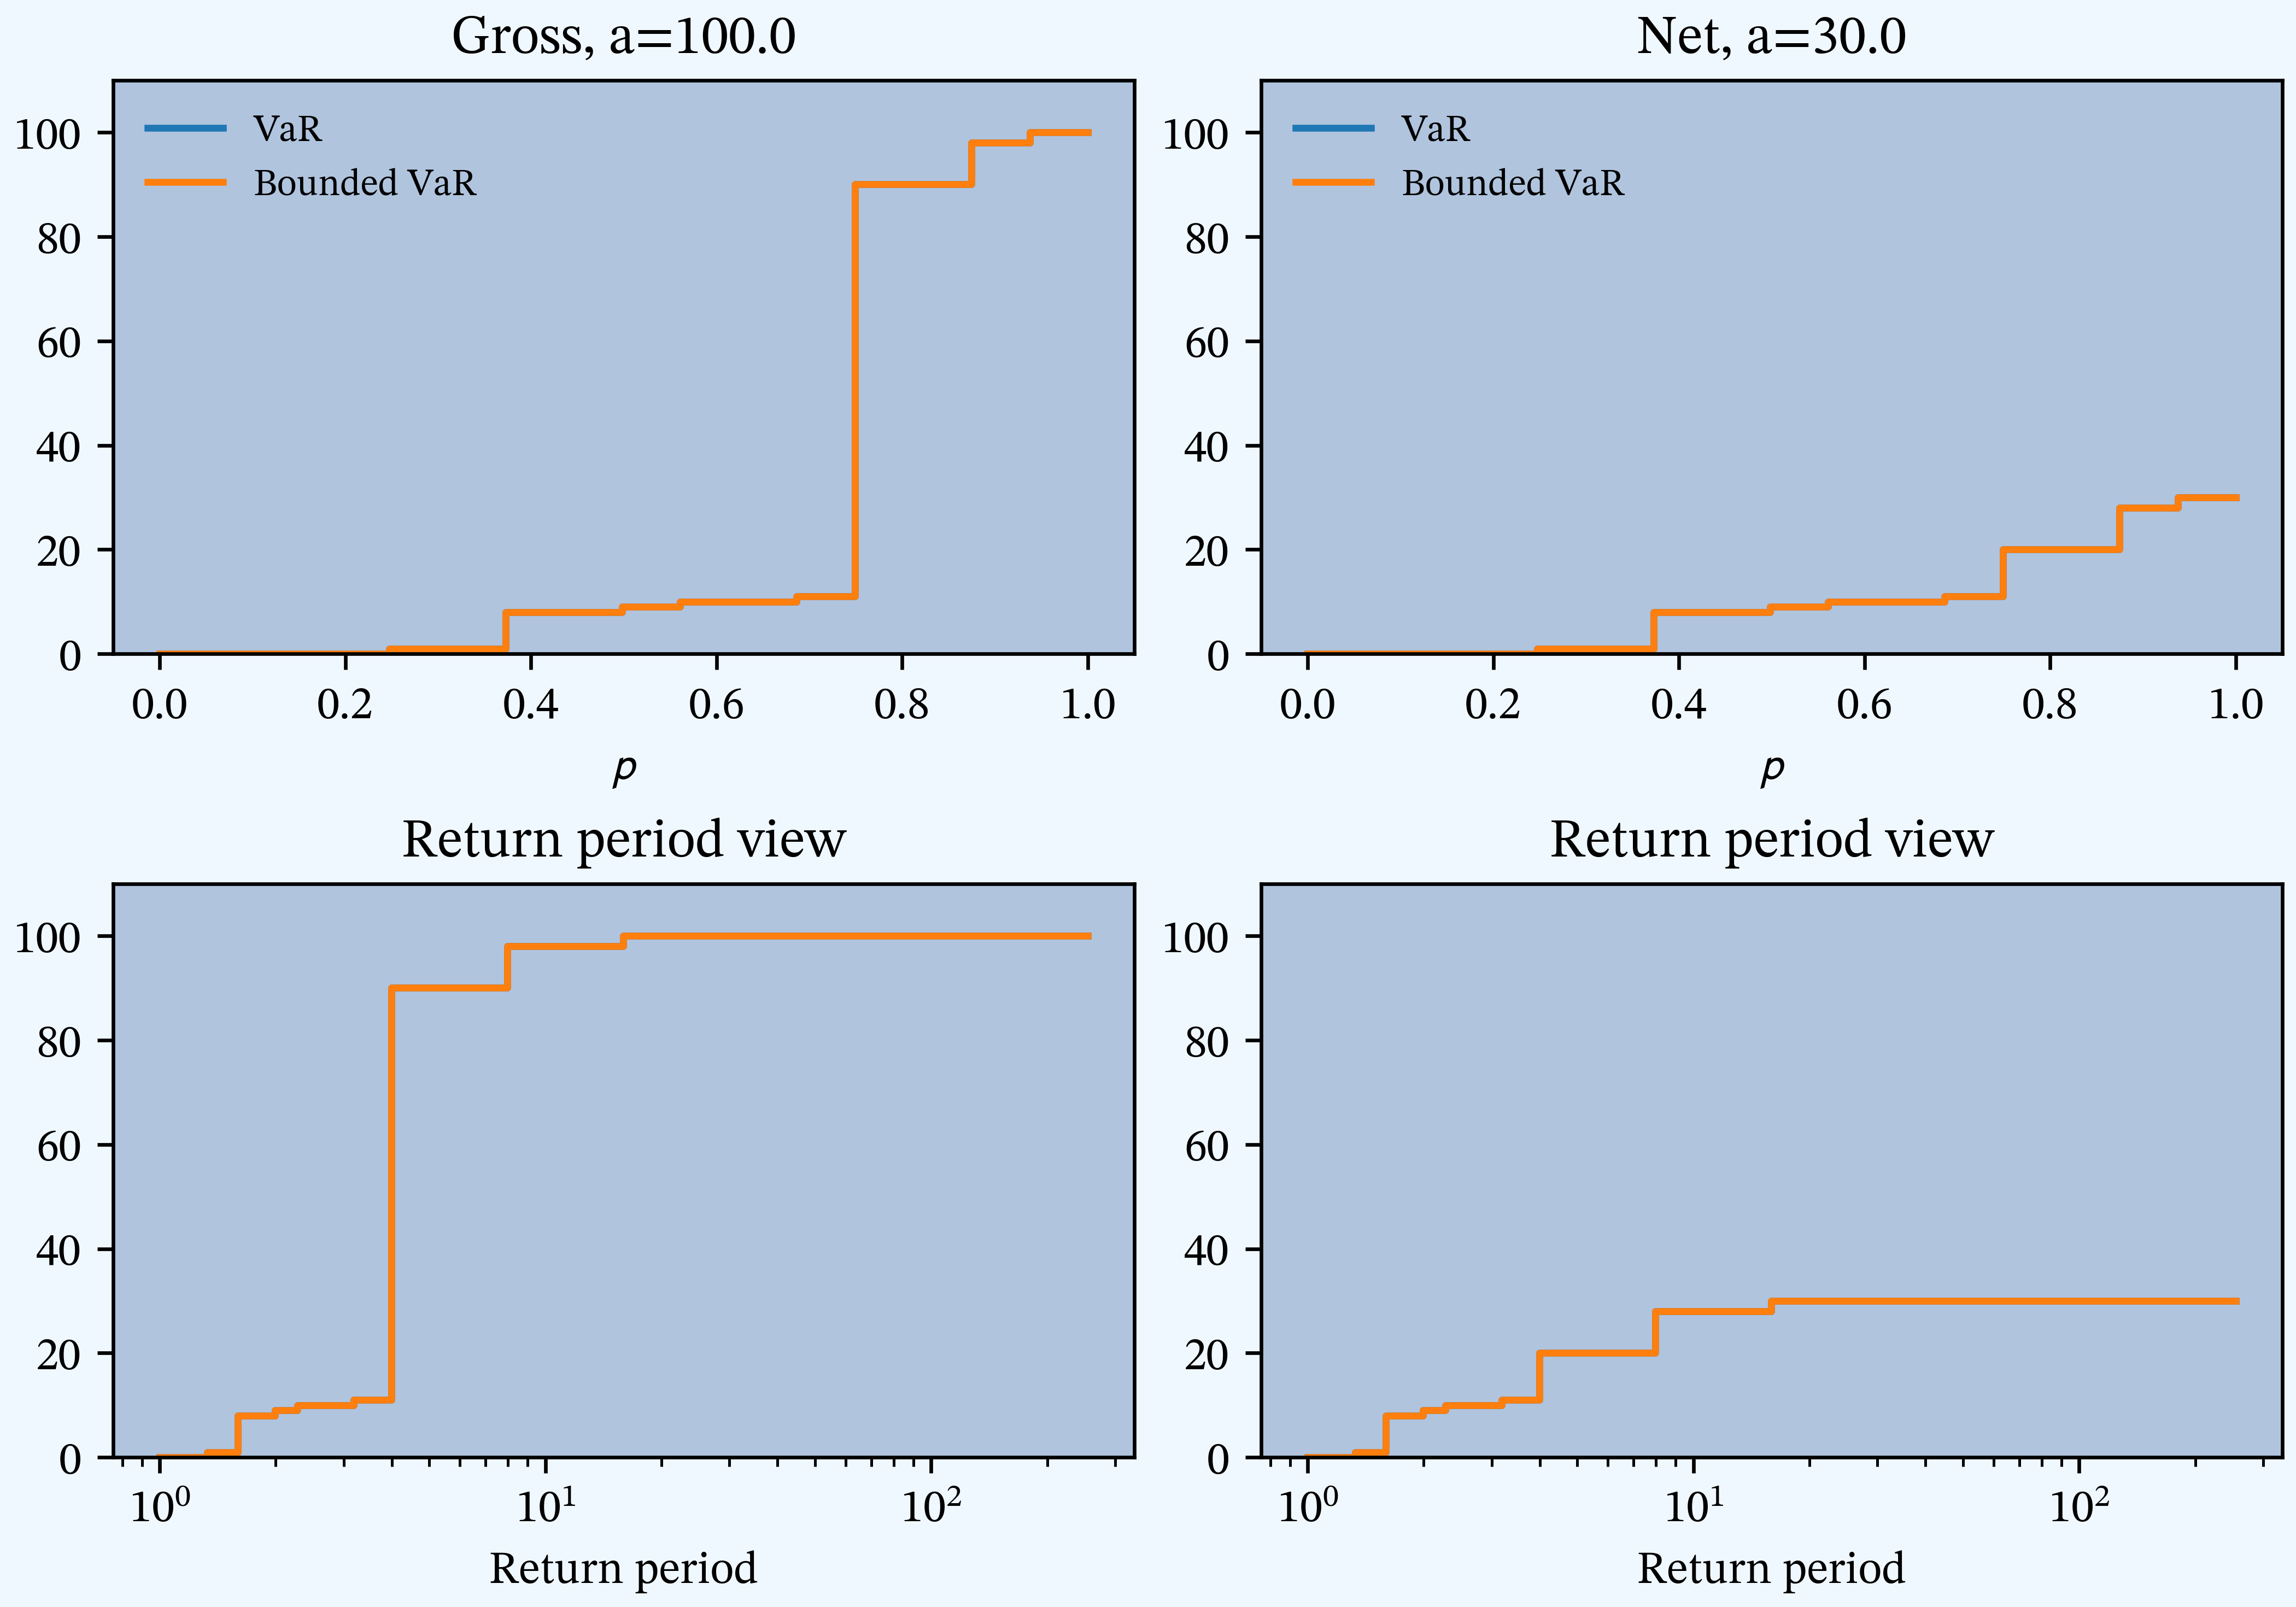
Table E
PIR Chapter 4, Tables 4.6, 4.7, 4.8, Estimated VaR, TVaR, and EPD by line and in total, gross, and net.
| statistic | Gross: X1 | Gross: X2 | Gross: Benefit | Gross: Sum | Gross: Total | Net: X1 | Net: X2 | Net: Benefit | Net: Sum | Net: Total |
|---|---|---|---|---|---|---|---|---|---|---|
| VaR 90.0 | 10 | 90 | 0.0204 | 100 | 98 | 10 | 20 | 0.0714 | 30 | 28 |
| VaR 95.0 | 10 | 90 | 0 | 100 | 100 | 10 | 20 | 0 | 30 | 30 |
| VaR 97.5 | 10 | 90 | 0 | 100 | 100 | 10 | 20 | 0 | 30 | 30 |
| VaR 99.0 | 10 | 90 | 0 | 100 | 100 | 10 | 20 | 0 | 30 | 30 |
| VaR 99.6 | 10 | 90 | 0 | 100 | 100 | 10 | 20 | 0 | 30 | 30 |
| VaR 99.9 | 10 | 90 | 0 | 100 | 100 | 10 | 20 | 0 | 30 | 30 |
| TVaR 90.0 | 10 | 90 | 0.00756 | 100 | 99.2 | 10 | 20 | 0.0256 | 30 | 29.2 |
| TVaR 95.0 | 10 | 90 | 0 | 100 | 100 | 10 | 20 | 0 | 30 | 30 |
| TVaR 97.5 | 10 | 90 | 0 | 100 | 100 | 10 | 20 | 0 | 30 | 30 |
| TVaR 99.0 | 10 | 90 | 0 | 100 | 100 | 10 | 20 | 0 | 30 | 30 |
| TVaR 99.6 | 10 | 90 | 0 | 100 | 100 | 10 | 20 | 0 | 30 | 30 |
| TVaR 99.9 | 10 | 90 | 0 | 100 | 100 | 10 | 20 | 0 | 30 | 30 |
| EPD 10.0 | 8.2 | 80.9 | 0.0658 | 89.1 | 83.6 | 8.2 | 17.9 | 0.231 | 26.1 | 21.2 |
| EPD 5.0 | 9.1 | 85.5 | 0.0618 | 94.5 | 89 | 9.1 | 18.9 | 0.118 | 28 | 25.1 |
| EPD 2.5 | 9.5 | 87.7 | 0.0398 | 97.3 | 93.5 | 9.5 | 19.5 | 0.073 | 29 | 27 |
| EPD 1.0 | 9.8 | 89.1 | 0.0216 | 98.9 | 96.8 | 9.8 | 19.8 | 0.0411 | 29.6 | 28.4 |
| EPD 0.4 | 9.9 | 89.6 | 0.0133 | 99.6 | 98.3 | 9.9 | 19.9 | 0.0159 | 29.8 | 29.4 |
| EPD 0.1 | 10 | 89.9 | 0.00328 | 99.9 | 99.6 | 10 | 20 | 0.00392 | 30 | 29.8 |
Table F
PIR Chapter 7, Table 7.2, Pricing summary.
| stat | Gross | Net |
|---|---|---|
| Loss | 27.25 | 9.75 |
| Margin | 6.614 | 1.841 |
| Premium | 33.864 | 11.591 |
| Loss Ratio | 0.805 | 0.841 |
| Capital | 66.136 | 18.409 |
| Rate of Return | 0.1 | 0.1 |
| Assets | 100 | 30 |
| Leverage | 0.512 | 0.63 |
Table H
PIR Chapter 9, Tables 9.2, 9.5, 9.8, Classical pricing by method.
| method | Parameters: Value | X1: Gross | X2: Net | X2: Gross | Total: Net | Total: Gross | Total: Ceded |
|---|---|---|---|---|---|---|---|
| Net | 4.5 | 5.2 | 22.8 | 9.8 | 27.2 | 17.5 | |
| VaR | 0.750 | 8 | 1 | 1 | 11 | 11 | 0 |
| Expected Value | 0.243 | 5.6 | 6.5 | 28.3 | 12.1 | 33.9 | 21.7 |
| Variance | 0.004 | 4.59 | 5.6 | 29.3 | 10.2 | 33.9 | 23.7 |
| Esscher | 0.004 | 4.583 | 5.5 | 29.3 | 10.1 | 33.9 | 23.7 |
| Standard Deviation | 0.169 | 5.3 | 6.7 | 29.3 | 11.4 | 33.9 | 22.5 |
| Semi-Variance | 0.006 | 4.562 | 5.6 | 29.3 | 10.1 | 33.9 | 23.8 |
| Fischer | 0.196 | 5.1 | 6.7 | 29.3 | 11.3 | 33.9 | 22.6 |
| Dutch | 0.393 | 5.4 | 6.7 | 29.4 | 11.2 | 33.9 | 22.6 |
Table I
PIR Chapter 9, Tables 9.3, 9.6, 9.9, Sum of parts (SoP) stand-alone vs. diversified classical pricing by method.
| method | Total: Gross | Total: Net | SoP: Gross | SoP: Net | Delta: Gross | Delta: Net |
|---|---|---|---|---|---|---|
| Net | 27.2 | 9.8 | 27.2 | 9.8 | 0 | 0 |
| VaR | 11 | 11 | 9 | 9 | -2 | -2 |
| Expected Value | 33.9 | 12.1 | 33.9 | 12.1 | 0 | -0 |
| Variance | 33.9 | 10.2 | 33.9 | 10.2 | 0 | 0 |
| Esscher | 33.9 | 10.1 | 33.9 | 10.1 | 0 | 0 |
| Standard Deviation | 33.9 | 11.4 | 34.6 | 12 | 0.726 | 0.578 |
| Semi-Variance | 33.9 | 10.1 | 33.9 | 10.1 | 0.032 | 0.031 |
| Fischer | 33.9 | 11.3 | 34.5 | 11.8 | 0.625 | 0.571 |
| Dutch | 33.9 | 11.2 | 34.7 | 12.1 | 0.885 | 0.842 |
Table J
PIR Chapter 9, Tables 9.4, 9.7, 9.10, Implied loss ratios from classical pricing by method.
| method | X1: Gross | X2: Net | X2: Gross | Total: Net | Total: Gross | Total: Ceded |
|---|---|---|---|---|---|---|
| Net | 1 | 1 | 1 | 1 | 1 | 1 |
| VaR | 0.562 | 5.2 | 22.8 | 0.886 | 2.477 | inf |
| Expected Value | 0.805 | 0.805 | 0.805 | 0.805 | 0.805 | 0.805 |
| Variance | 0.98 | 0.943 | 0.777 | 0.96 | 0.805 | 0.738 |
| Esscher | 0.982 | 0.947 | 0.777 | 0.963 | 0.805 | 0.737 |
| Standard Deviation | 0.854 | 0.784 | 0.776 | 0.856 | 0.805 | 0.779 |
| Semi-Variance | 0.986 | 0.943 | 0.776 | 0.966 | 0.805 | 0.736 |
| Fischer | 0.876 | 0.784 | 0.775 | 0.865 | 0.805 | 0.774 |
| Dutch | 0.836 | 0.784 | 0.775 | 0.867 | 0.805 | 0.774 |
Table K
PIR Chapter 9, Table 9.11, Comparison of stand-alone and sum of parts premium.
| Gross SoP | Gross Total | Gross Redn | Net SoP | Net Total | Net Redn | |
|---|---|---|---|---|---|---|
| No Default: Loss | 27.2 | 27.2 | -0.0% | 975.0% | 975.0% | 0.0% |
| No Default: Premium | 33.9 | 33.9 | 0.0% | 11.6 | 11.6 | 0.0% |
| No Default: Capital | 66.1 | 66.1 | 0.0% | 18.4 | 18.4 | 0.0% |
| With Default: Loss | 27.2 | 27.2 | 0.0% | 975.0% | 975.0% | 0.0% |
| With Default: Premium | 33.9 | 33.9 | 0.0% | 11.6 | 11.6 | 0.0% |
| With Default: Capital | 66.1 | 66.1 | 0.0% | 18.4 | 18.4 | 0.0% |
Table L
PIR Chapter 9, Tables 9.12, 9.13, 9.14, Constant CoC pricing by unit for Case Study.
| Gross: X1 | Gross: X2 | Gross: SoP | Gross: Total | Net: X1 | Net: SoP | Net: Total | |
|---|---|---|---|---|---|---|---|
| No Default: Loss | 4.5 | 22.8 | 27.2 | 27.2 | 4.5 | 9.8 | 9.8 |
| No Default: Margin | 0.5 | 6.1 | 6.6 | 6.6 | 0.5 | 1.841 | 1.841 |
| No Default: Premium | 5 | 28.9 | 33.9 | 33.9 | 5 | 11.6 | 11.6 |
| No Default: Loss Ratio | 0.9 | 0.788 | 0.805 | 0.805 | 0.9 | 0.841 | 0.841 |
| No Default: Capital | 5 | 61.1 | 66.1 | 66.1 | 5 | 18.4 | 18.4 |
| No Default: Rate of Return | 0.1 | 0.1 | 0.1 | 0.1 | 0.1 | 0.1 | 0.1 |
| No Default: Leverage | 1 | 0.472 | 0.512 | 0.512 | 1 | 0.63 | 0.63 |
| No Default: Assets | 10 | 90 | 100 | 100 | 10 | 30 | 30 |
| With Default: Loss | 4.5 | 22.8 | 27.2 | 27.2 | 4.5 | 9.8 | 9.8 |
| With Default: Margin | 0.5 | 6.1 | 6.6 | 6.6 | 0.5 | 1.841 | 1.841 |
| With Default: Premium | 5 | 28.9 | 33.9 | 33.9 | 5 | 11.6 | 11.6 |
| With Default: Loss Ratio | 0.9 | 0.788 | 0.805 | 0.805 | 0.9 | 0.841 | 0.841 |
| With Default: Capital | 5 | 61.1 | 66.1 | 66.1 | 5 | 18.4 | 18.4 |
| With Default: Rate of Return | 0.1 | 0.1 | 0.1 | 0.1 | 0.1 | 0.1 | 0.1 |
| With Default: Leverage | 1 | 0.472 | 0.512 | 0.512 | 1 | 0.63 | 0.63 |
| With Default: Assets | 10 | 90 | 100 | 100 | 10 | 30 | 30 |
Figure M
PIR Chapter 11, Figures 11.2, 11.3, 11.4,11.5, Distortion envelope for Case Study, gross.
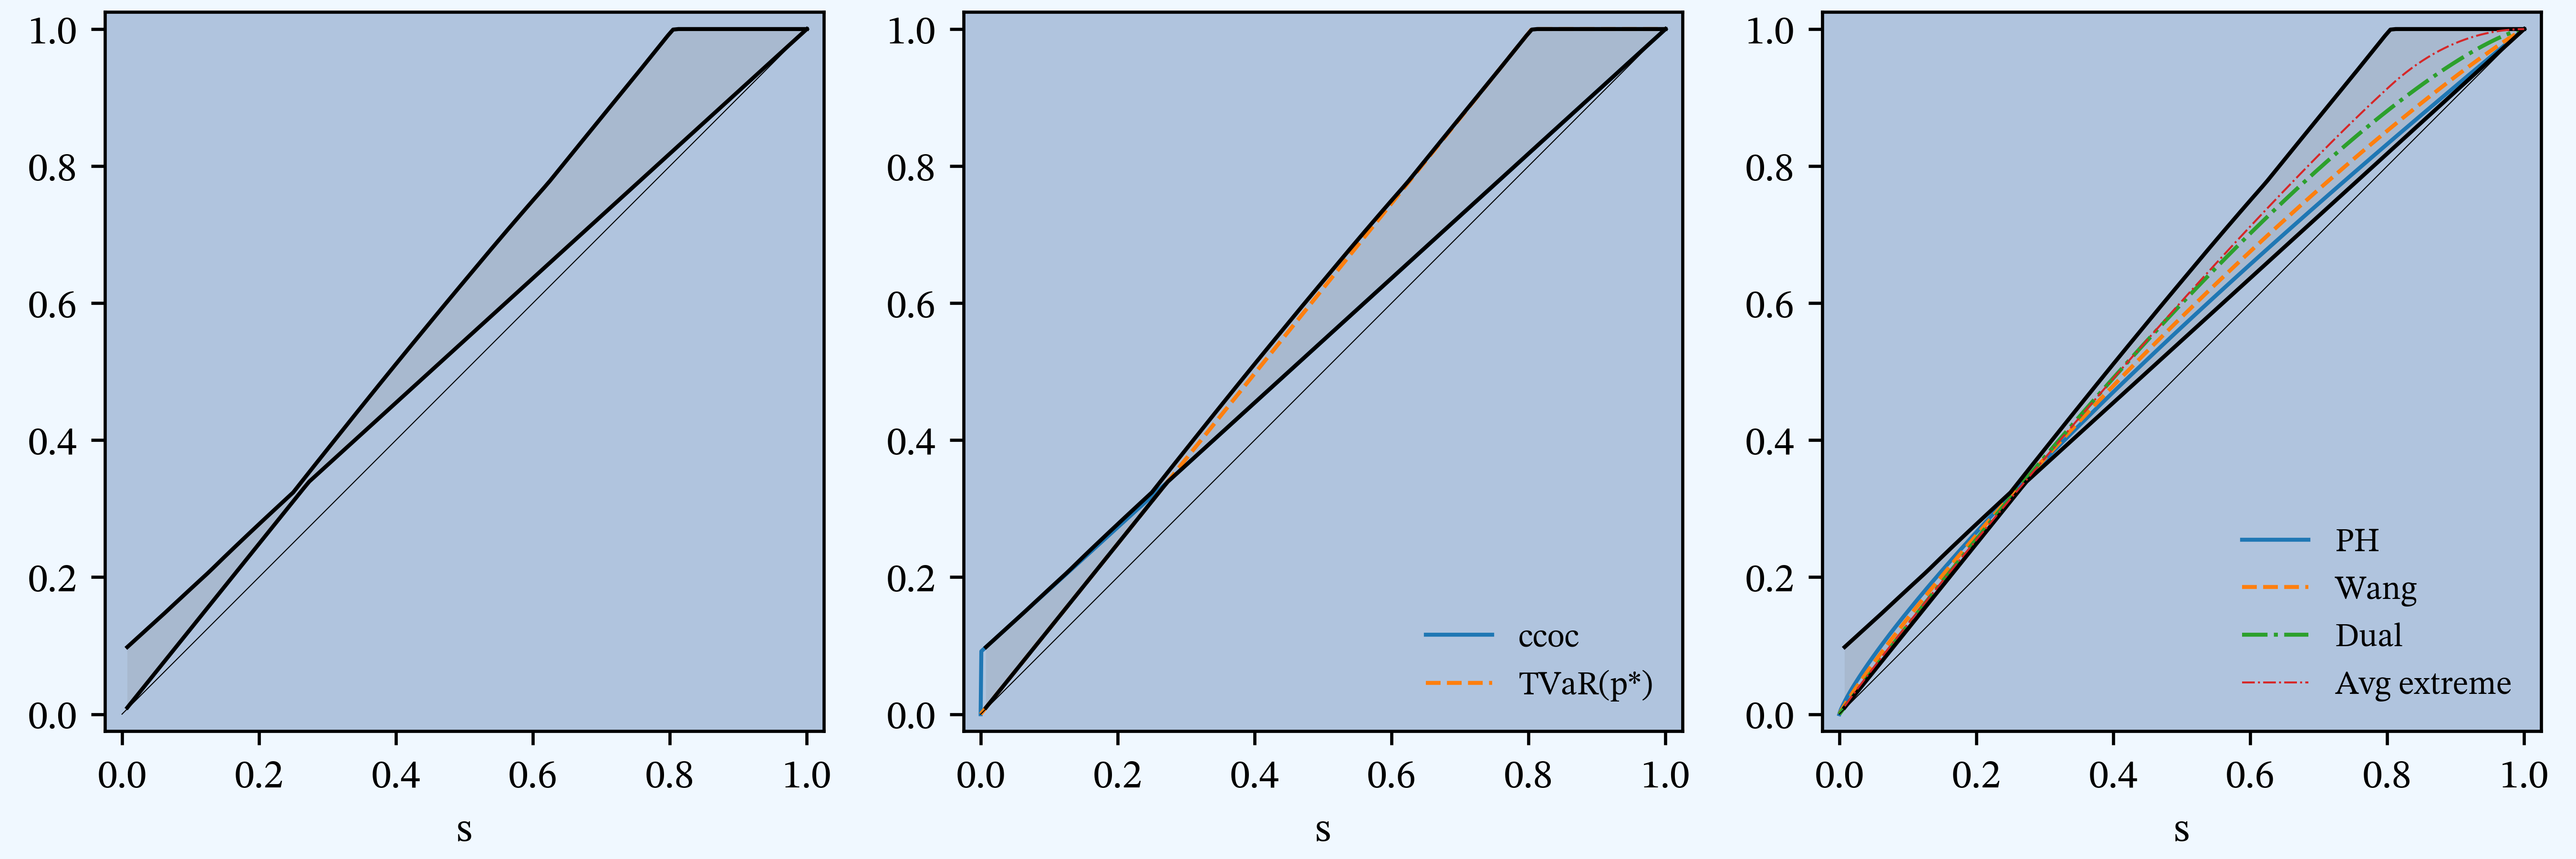
Table N
PIR Chapter 11, Table 11.5, Parameters for the six SRMs and associated distortions.
| method | Param | Error | Premium | K | Ι | S |
|---|---|---|---|---|---|---|
| Ccoc | 0.1 | 0 | 33.864 | 66.136 | 0.1 | 0 |
| PH | 0.824 | 0 | 33.864 | 66.136 | 0.1 | 0 |
| Wang | 0.201 | 0 | 33.864 | 66.136 | 0.1 | 0 |
| Dual | 1.32 | -0 | 33.864 | 66.136 | 0.1 | 0 |
| Tvar | 0.195 | 0 | 33.864 | 66.136 | 0.1 | 0 |
Figure O
PIR Chapter 11, Figures 11.6, 11.7, 11.8, Variation in insurance statistics for six distortions as \(s\) varies.
Figure P
PIR Chapter 11, Figures 11.9, 11.10, 11.11, Variation in insurance statistics as the asset limit is varied.
Table Q
PIR Chapter 11, Tables 11.7, 11.8, 11.9, Pricing by unit and distortion for Case Study.
| Gross: X1 | Gross: X2 | Gross: SoP | Gross: Total | Net: X1 | Net: SoP | Net: Total | |
|---|---|---|---|---|---|---|---|
| Loss: Ccoc | 4.5 | 22.75 | 27.25 | 27.25 | 4.5 | 9.75 | 9.75 |
| Margin: Ccoc | 0.5 | 6.114 | 6.614 | 6.614 | 0.5 | 1.841 | 1.841 |
| Margin: PH | 0.659 | 6.227 | 6.886 | 6.614 | 0.659 | 2.039 | 1.767 |
| Margin: Wang | 0.775 | 6.138 | 6.912 | 6.614 | 0.775 | 2.148 | 1.849 |
| Margin: Dual | 0.928 | 5.973 | 6.901 | 6.614 | 0.928 | 2.281 | 1.994 |
| Margin: TVaR | 1.092 | 5.521 | 6.614 | 6.614 | 1.092 | 2.366 | 2.366 |
| Margin: Blend | 0.825 | 5.799 | 6.623 | 6.614 | 0.825 | 2.131 | 2.121 |
| Premium: Ccoc | 5 | 28.864 | 33.864 | 33.864 | 5 | 11.591 | 11.591 |
| Premium: PH | 5.159 | 28.977 | 34.136 | 33.864 | 5.159 | 11.789 | 11.517 |
| Premium: Wang | 5.275 | 28.888 | 34.162 | 33.864 | 5.275 | 11.898 | 11.599 |
| Premium: Dual | 5.428 | 28.723 | 34.151 | 33.864 | 5.428 | 12.031 | 11.744 |
| Premium: TVaR | 5.592 | 28.271 | 33.864 | 33.864 | 5.592 | 12.116 | 12.116 |
| Premium: Blend | 5.325 | 28.549 | 33.873 | 33.864 | 5.325 | 11.881 | 11.871 |
| Loss Ratio: Ccoc | 0.9 | 0.788 | 0.805 | 0.805 | 0.9 | 0.841 | 0.841 |
| Loss Ratio: PH | 0.872 | 0.785 | 0.798 | 0.805 | 0.872 | 0.827 | 0.847 |
| Loss Ratio: Wang | 0.853 | 0.788 | 0.798 | 0.805 | 0.853 | 0.819 | 0.841 |
| Loss Ratio: Dual | 0.829 | 0.792 | 0.798 | 0.805 | 0.829 | 0.81 | 0.83 |
| Loss Ratio: TVaR | 0.805 | 0.805 | 0.805 | 0.805 | 0.805 | 0.805 | 0.805 |
| Loss Ratio: Blend | 0.845 | 0.797 | 0.804 | 0.805 | 0.845 | 0.821 | 0.821 |
| Capital: Ccoc | 5 | 61.136 | 66.136 | 66.136 | 5 | 18.409 | 18.409 |
| Capital: PH | 4.841 | 61.023 | 65.864 | 66.136 | 4.841 | 18.211 | 18.483 |
| Capital: Wang | 4.725 | 61.112 | 65.838 | 66.136 | 4.725 | 18.102 | 18.401 |
| Capital: Dual | 4.572 | 61.277 | 65.849 | 66.136 | 4.572 | 17.969 | 18.256 |
| Capital: TVaR | 4.408 | 61.729 | 66.136 | 66.136 | 4.408 | 17.884 | 17.884 |
| Capital: Blend | 4.675 | 61.451 | 66.127 | 66.136 | 4.675 | 18.119 | 18.129 |
| Rate of Return: Ccoc | 0.1 | 0.1 | 0.1 | 0.1 | 0.1 | 0.1 | 0.1 |
| Rate of Return: PH | 0.136 | 0.102 | 0.105 | 0.1 | 0.136 | 0.112 | 0.096 |
| Rate of Return: Wang | 0.164 | 0.1 | 0.105 | 0.1 | 0.164 | 0.119 | 0.1 |
| Rate of Return: Dual | 0.203 | 0.097 | 0.105 | 0.1 | 0.203 | 0.127 | 0.109 |
| Rate of Return: TVaR | 0.248 | 0.089 | 0.1 | 0.1 | 0.248 | 0.132 | 0.132 |
| Rate of Return: Blend | 0.176 | 0.094 | 0.1 | 0.1 | 0.176 | 0.118 | 0.117 |
| Leverage: Ccoc | 1 | 0.472 | 0.512 | 0.512 | 1 | 0.63 | 0.63 |
| Leverage: PH | 1.066 | 0.475 | 0.518 | 0.512 | 1.066 | 0.647 | 0.623 |
| Leverage: Wang | 1.116 | 0.473 | 0.519 | 0.512 | 1.116 | 0.657 | 0.63 |
| Leverage: Dual | 1.187 | 0.469 | 0.519 | 0.512 | 1.187 | 0.67 | 0.643 |
| Leverage: TVaR | 1.269 | 0.458 | 0.512 | 0.512 | 1.269 | 0.678 | 0.678 |
| Leverage: Blend | 1.139 | 0.465 | 0.512 | 0.512 | 1.139 | 0.656 | 0.655 |
| Assets: Ccoc | 10 | 90 | 100 | 100 | 10 | 30 | 30 |
Table R
PIR Chapter 13, Table 13.1, Comparison of gross expected losses by Case, catastrophe-prone lines.
| Unit | a | E[Xi(a)] | E[Xi ∧ ai] |
|---|---|---|---|
| X1 | 10 | 4.5 | 4.5 |
| X2 | 90 | 22.75 | 22.75 |
| Total | 100 | 27.25 | 27.25 |
| SoP | 100 | 27.25 | 27.25 |
Table S
PIR Chapter 13, Tables 13.2, 13.3, 13.4, Constant 0.10 ROE pricing for Case Study, classical PCP methods.
| Gross: X1 | Gross: X2 | Gross: Total | Net: X1 | Net: X2 | Net: Total | Ceded: Diff | |
|---|---|---|---|---|---|---|---|
| Loss: Expected Loss | 4.5 | 22.75 | 27.25 | 4.5 | 5.25 | 9.75 | 17.5 |
| Margin: Expected Loss | 1.092 | 5.521 | 6.614 | 0.85 | 0.991 | 1.841 | 4.773 |
| Margin: Scaled EPD | 0.5 | 6.114 | 6.614 | 0.5 | 1.341 | 1.841 | 4.773 |
| Margin: Scaled TVaR | 0.5 | 6.114 | 6.614 | 0.5 | 1.341 | 1.841 | 4.773 |
| Margin: Scaled VaR | 0.5 | 6.114 | 6.614 | 0.5 | 1.341 | 1.841 | 4.773 |
| Margin: Equal Risk EPD | 0.5 | 6.114 | 6.614 | 0.5 | 1.341 | 1.841 | 4.773 |
| Margin: Equal Risk TVaR | 0.5 | 6.114 | 6.614 | 0.5 | 1.341 | 1.841 | 4.773 |
| Margin: Equal Risk VaR | 0.5 | 6.114 | 6.614 | 0.5 | 1.341 | 1.841 | 4.773 |
| Margin: coTVaR | nan | nan | -inf | nan | nan | nan | nan |
| Margin: Covar | 0.09 | 6.524 | 6.614 | 0.409 | 1.432 | 1.841 | 4.773 |
| Premium: Expected Loss | 5.592 | 28.271 | 33.864 | 5.35 | 6.241 | 11.591 | 22.273 |
| Premium: Scaled EPD | 5 | 28.864 | 33.864 | 5 | 6.591 | 11.591 | 22.273 |
| Premium: Scaled TVaR | 5 | 28.864 | 33.864 | 5 | 6.591 | 11.591 | 22.273 |
| Premium: Scaled VaR | 5 | 28.864 | 33.864 | 5 | 6.591 | 11.591 | 22.273 |
| Premium: Equal Risk EPD | 5 | 28.864 | 33.864 | 5 | 6.591 | 11.591 | 22.273 |
| Premium: Equal Risk TVaR | 5 | 28.864 | 33.864 | 5 | 6.591 | 11.591 | 22.273 |
| Premium: Equal Risk VaR | 5 | 28.864 | 33.864 | 5 | 6.591 | 11.591 | 22.273 |
| Premium: coTVaR | nan | nan | -inf | nan | nan | nan | nan |
| Premium: Covar | 4.59 | 29.274 | 33.864 | 4.909 | 6.682 | 11.591 | 22.273 |
| Loss Ratio: Expected Loss | 0.805 | 0.805 | 0.805 | 0.841 | 0.841 | 0.841 | 0.786 |
| Loss Ratio: Scaled EPD | 0.9 | 0.788 | 0.805 | 0.9 | 0.797 | 0.841 | 0.786 |
| Loss Ratio: Scaled TVaR | 0.9 | 0.788 | 0.805 | 0.9 | 0.797 | 0.841 | 0.786 |
| Loss Ratio: Scaled VaR | 0.9 | 0.788 | 0.805 | 0.9 | 0.797 | 0.841 | 0.786 |
| Loss Ratio: Equal Risk EPD | 0.9 | 0.788 | 0.805 | 0.9 | 0.797 | 0.841 | 0.786 |
| Loss Ratio: Equal Risk TVaR | 0.9 | 0.788 | 0.805 | 0.9 | 0.797 | 0.841 | 0.786 |
| Loss Ratio: Equal Risk VaR | 0.9 | 0.788 | 0.805 | 0.9 | 0.797 | 0.841 | 0.786 |
| Loss Ratio: coTVaR | nan | nan | -0 | nan | nan | nan | nan |
| Loss Ratio: Covar | 0.98 | 0.777 | 0.805 | 0.917 | 0.786 | 0.841 | 0.786 |
| Capital: Expected Loss | 10.922 | 55.215 | 66.136 | 8.497 | 9.913 | 18.409 | 47.727 |
| Capital: Scaled EPD | 5 | 61.136 | 66.136 | 5 | 13.409 | 18.409 | 47.727 |
| Capital: Scaled TVaR | 5 | 61.136 | 66.136 | 5 | 13.409 | 18.409 | 47.727 |
| Capital: Scaled VaR | 5 | 61.136 | 66.136 | 5 | 13.409 | 18.409 | 47.727 |
| Capital: Equal Risk EPD | 5 | 61.136 | 66.136 | 5 | 13.409 | 18.409 | 47.727 |
| Capital: Equal Risk TVaR | 5 | 61.136 | 66.136 | 5 | 13.409 | 18.409 | 47.727 |
| Capital: Equal Risk VaR | 5 | 61.136 | 66.136 | 5 | 13.409 | 18.409 | 47.727 |
| Capital: coTVaR | nan | nan | nan | nan | nan | nan | nan |
| Capital: Covar | 0.898 | 65.238 | 66.136 | 4.088 | 14.321 | 18.409 | 47.727 |
| Rate of Return: Expected Loss | 0.1 | 0.1 | 0.1 | 0.1 | 0.1 | 0.1 | 0.1 |
| Rate of Return: Scaled EPD | 0.1 | 0.1 | 0.1 | 0.1 | 0.1 | 0.1 | 0.1 |
| Rate of Return: Scaled TVaR | 0.1 | 0.1 | 0.1 | 0.1 | 0.1 | 0.1 | 0.1 |
| Rate of Return: Scaled VaR | 0.1 | 0.1 | 0.1 | 0.1 | 0.1 | 0.1 | 0.1 |
| Rate of Return: Equal Risk EPD | 0.1 | 0.1 | 0.1 | 0.1 | 0.1 | 0.1 | 0.1 |
| Rate of Return: Equal Risk TVaR | 0.1 | 0.1 | 0.1 | 0.1 | 0.1 | 0.1 | 0.1 |
| Rate of Return: Equal Risk VaR | 0.1 | 0.1 | 0.1 | 0.1 | 0.1 | 0.1 | 0.1 |
| Rate of Return: coTVaR | nan | nan | nan | nan | nan | nan | nan |
| Rate of Return: Covar | 0.1 | 0.1 | 0.1 | 0.1 | 0.1 | 0.1 | 0.1 |
| Leverage: Expected Loss | 0.512 | 0.512 | 0.512 | 0.63 | 0.63 | 0.63 | 0.467 |
| Leverage: Scaled EPD | 1 | 0.472 | 0.512 | 1 | 0.492 | 0.63 | 0.467 |
| Leverage: Scaled TVaR | 1 | 0.472 | 0.512 | 1 | 0.492 | 0.63 | 0.467 |
| Leverage: Scaled VaR | 1 | 0.472 | 0.512 | 1 | 0.492 | 0.63 | 0.467 |
| Leverage: Equal Risk EPD | 1 | 0.472 | 0.512 | 1 | 0.492 | 0.63 | 0.467 |
| Leverage: Equal Risk TVaR | 1 | 0.472 | 0.512 | 1 | 0.492 | 0.63 | 0.467 |
| Leverage: Equal Risk VaR | 1 | 0.472 | 0.512 | 1 | 0.492 | 0.63 | 0.467 |
| Leverage: coTVaR | nan | nan | nan | nan | nan | nan | nan |
| Leverage: Covar | 5.112 | 0.449 | 0.512 | 1.201 | 0.467 | 0.63 | 0.467 |
| Assets: Expected Loss | 16.514 | 83.486 | 100 | 13.846 | 16.154 | 30 | 70 |
| Assets: Scaled EPD | 10 | 90 | 100 | 10 | 20 | 30 | 70 |
| Assets: Scaled TVaR | 10 | 90 | 100 | 10 | 20 | 30 | 70 |
| Assets: Scaled VaR | 10 | 90 | 100 | 10 | 20 | 30 | 70 |
| Assets: Equal Risk EPD | 10 | 90 | 100 | 10 | 20 | 30 | 70 |
| Assets: Equal Risk TVaR | 10 | 90 | 100 | 10 | 20 | 30 | 70 |
| Assets: Equal Risk VaR | 10 | 90 | 100 | 10 | 20 | 30 | 70 |
| Assets: coTVaR | nan | nan | nan | nan | nan | nan | nan |
| Assets: Covar | 5.488 | 94.512 | 100 | 8.997 | 21.003 | 30 | 70 |
Figure T_gross
Figure T_net
Figure U
PIR Chapter 15, Figures 15.8, 15.9, 15.10, Capital density by layer.
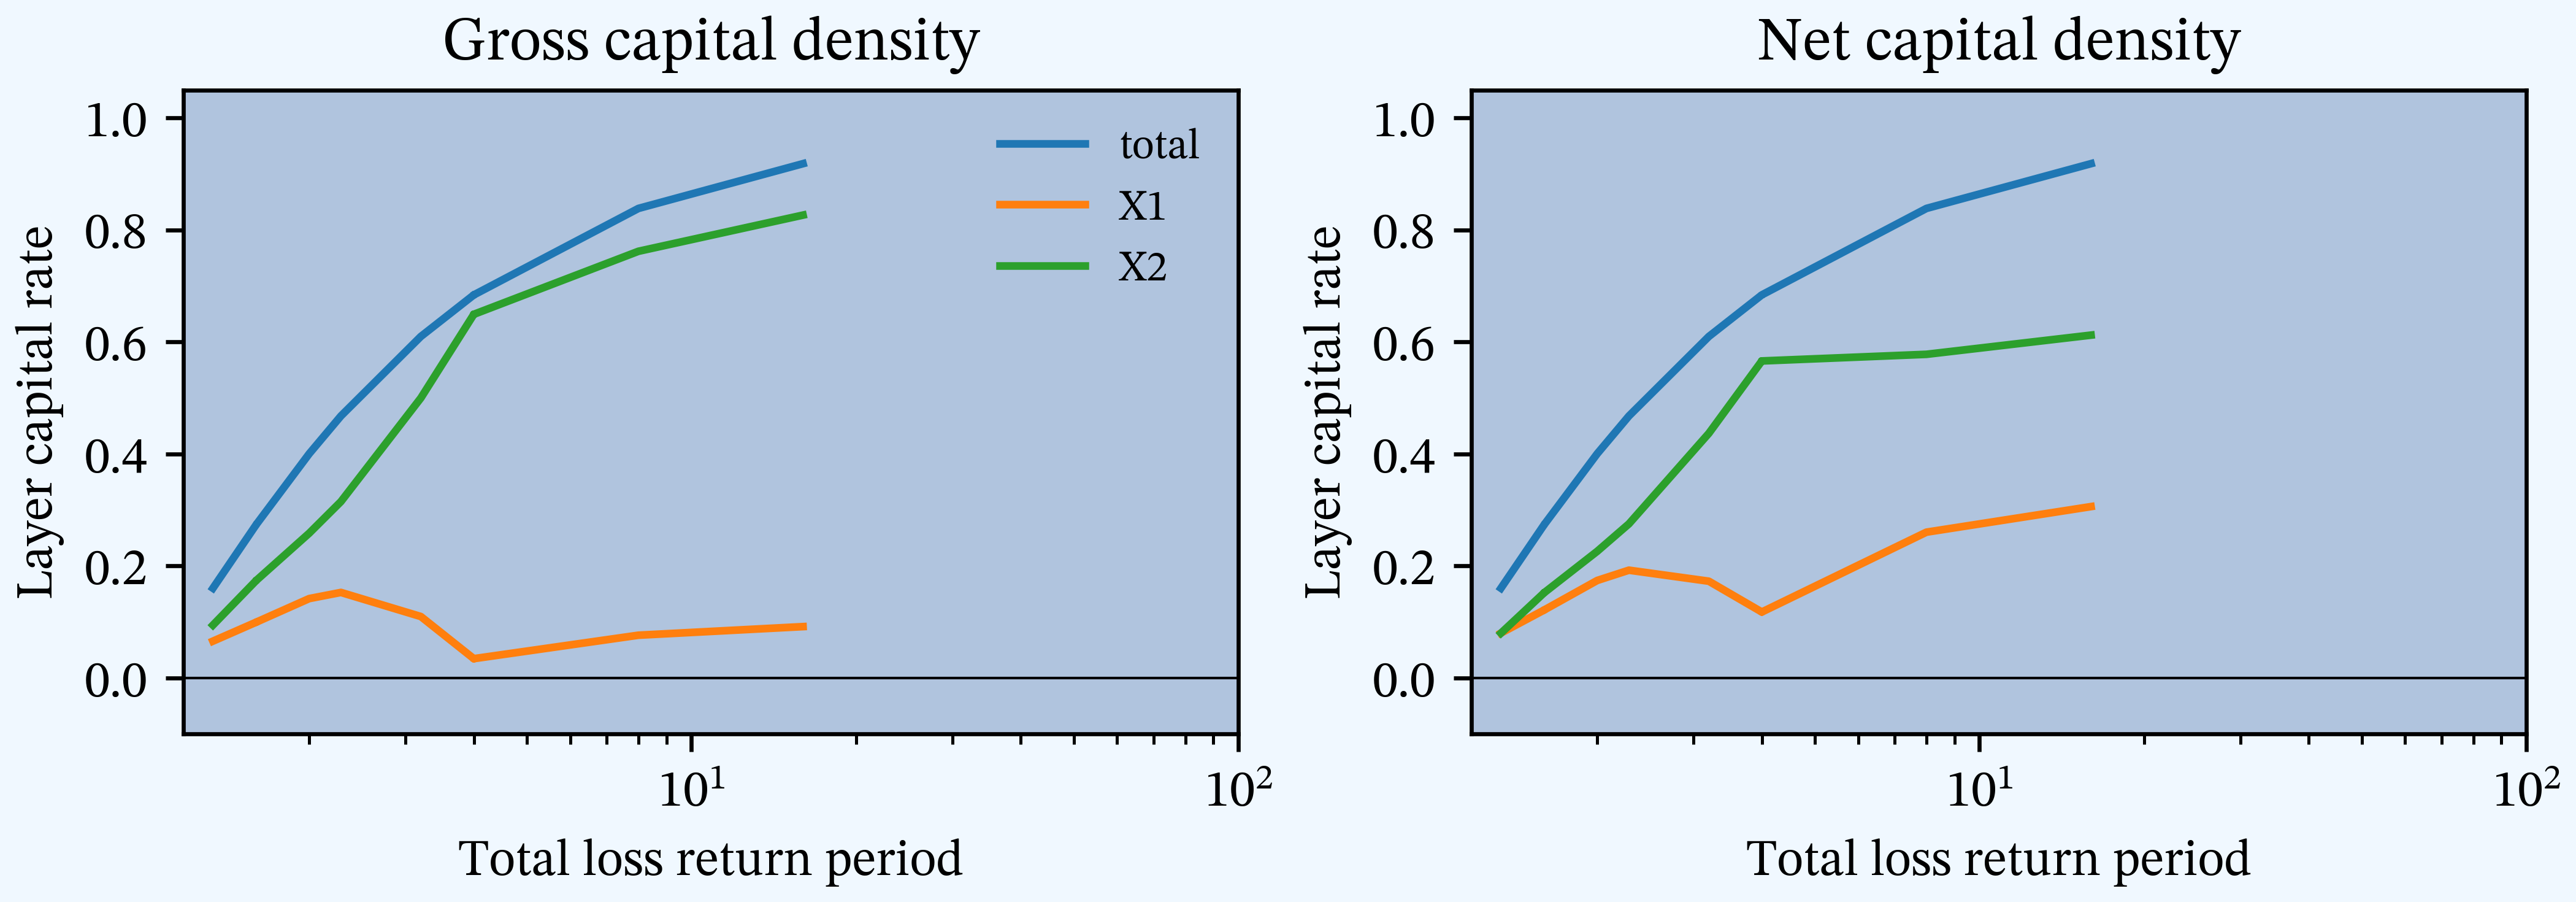
Table V
PIR Chapter 15, Tables 15.35, 15.36, 15.37, Constant 0.10 ROE pricing for Cat/Non-Cat Case Study, distortion, SRM methods.
| Gross: X1 | Gross: X2 | Gross: Total | Net: X1 | Net: X2 | Net: Total | Ceded: Diff | |
|---|---|---|---|---|---|---|---|
| Loss: Expected Loss | 4.5 | 22.75 | 27.25 | 4.5 | 5.25 | 9.75 | 17.5 |
| Margin: Expected Loss | 1.092 | 5.52 | 6.61 | 0.85 | 0.991 | 1.841 | 4.773 |
| Margin: Dist Ccoc | 0.5 | 6.11 | 6.61 | 0.5 | 1.341 | 1.841 | 4.773 |
| Margin: Dist PH | 0.399 | 6.21 | 6.61 | 0.399 | 1.368 | 1.767 | 4.847 |
| Margin: Dist Wang | 0.495 | 6.12 | 6.61 | 0.495 | 1.353 | 1.849 | 4.765 |
| Margin: Dist Dual | 0.669 | 5.94 | 6.61 | 0.669 | 1.325 | 1.994 | 4.619 |
| Margin: Dist Tvar | 1.092 | 5.52 | 6.61 | 1.092 | 1.274 | 2.366 | 4.247 |
| Margin: Dist Blend | 0.825 | 5.79 | 6.61 | 0.825 | 1.297 | 2.121 | 4.492 |
| Premium: Expected Loss | 5.59 | 28.27 | 33.86 | 5.35 | 6.24 | 11.59 | 22.27 |
| Premium: Dist Ccoc | 5 | 28.86 | 33.86 | 5 | 6.59 | 11.59 | 22.27 |
| Premium: Dist PH | 4.899 | 28.96 | 33.86 | 4.899 | 6.62 | 11.52 | 22.35 |
| Premium: Dist Wang | 4.995 | 28.87 | 33.86 | 4.995 | 6.6 | 11.6 | 22.26 |
| Premium: Dist Dual | 5.17 | 28.69 | 33.86 | 5.17 | 6.58 | 11.74 | 22.12 |
| Premium: Dist Tvar | 5.59 | 28.27 | 33.86 | 5.59 | 6.52 | 12.12 | 21.75 |
| Premium: Dist Blend | 5.32 | 28.54 | 33.86 | 5.32 | 6.55 | 11.87 | 21.99 |
| Loss Ratio: Expected Loss | 0.805 | 0.805 | 0.805 | 0.841 | 0.841 | 0.841 | 0.786 |
| Loss Ratio: Dist Ccoc | 0.9 | 0.788 | 0.805 | 0.9 | 0.797 | 0.841 | 0.786 |
| Loss Ratio: Dist PH | 0.919 | 0.785 | 0.805 | 0.919 | 0.793 | 0.847 | 0.783 |
| Loss Ratio: Dist Wang | 0.901 | 0.788 | 0.805 | 0.901 | 0.795 | 0.841 | 0.786 |
| Loss Ratio: Dist Dual | 0.871 | 0.793 | 0.805 | 0.871 | 0.798 | 0.83 | 0.791 |
| Loss Ratio: Dist Tvar | 0.805 | 0.805 | 0.805 | 0.805 | 0.805 | 0.805 | 0.805 |
| Loss Ratio: Dist Blend | 0.845 | 0.797 | 0.805 | 0.845 | 0.802 | 0.821 | 0.796 |
| Capital: Expected Loss | 10.92 | 55.21 | 66.14 | 8.5 | 9.91 | 18.41 | 47.73 |
| Capital: Dist Ccoc | 5 | 61.14 | 66.14 | 5 | 13.41 | 18.41 | 47.73 |
| Capital: Dist PH | 4.517 | 61.62 | 66.14 | 4.769 | 13.71 | 18.48 | 47.65 |
| Capital: Dist Wang | 4.762 | 61.37 | 66.14 | 5.1 | 13.31 | 18.4 | 47.74 |
| Capital: Dist Dual | 4.701 | 61.44 | 66.14 | 5.23 | 13.03 | 18.26 | 47.88 |
| Capital: Dist Tvar | 4.763 | 61.37 | 66.14 | 5.33 | 12.55 | 17.88 | 48.25 |
| Capital: Dist Blend | 6.35 | 59.79 | 66.14 | 6.07 | 12.06 | 18.13 | 48.01 |
| Rate of Return: Expected Loss | 0.1 | 0.1 | 0.1 | 0.1 | 0.1 | 0.1 | 0.1 |
| Rate of Return: Dist Ccoc | 0.1 | 0.1 | 0.1 | 0.1 | 0.1 | 0.1 | 0.1 |
| Rate of Return: Dist PH | 0.088 | 0.101 | 0.1 | 0.084 | 0.1 | 0.096 | 0.102 |
| Rate of Return: Dist Wang | 0.104 | 0.1 | 0.1 | 0.097 | 0.102 | 0.1 | 0.1 |
| Rate of Return: Dist Dual | 0.142 | 0.097 | 0.1 | 0.128 | 0.102 | 0.109 | 0.096 |
| Rate of Return: Dist Tvar | 0.229 | 0.09 | 0.1 | 0.205 | 0.102 | 0.132 | 0.088 |
| Rate of Return: Dist Blend | 0.13 | 0.097 | 0.1 | 0.136 | 0.108 | 0.117 | 0.094 |
| Leverage: Expected Loss | 0.512 | 0.512 | 0.512 | 0.63 | 0.63 | 0.63 | 0.467 |
| Leverage: Dist Ccoc | 1 | 0.472 | 0.512 | 1 | 0.492 | 0.63 | 0.467 |
| Leverage: Dist PH | 1.085 | 0.47 | 0.512 | 1.027 | 0.483 | 0.623 | 0.469 |
| Leverage: Dist Wang | 1.049 | 0.47 | 0.512 | 0.98 | 0.496 | 0.63 | 0.466 |
| Leverage: Dist Dual | 1.1 | 0.467 | 0.512 | 0.989 | 0.505 | 0.643 | 0.462 |
| Leverage: Dist Tvar | 1.174 | 0.461 | 0.512 | 1.049 | 0.52 | 0.678 | 0.451 |
| Leverage: Dist Blend | 0.839 | 0.477 | 0.512 | 0.877 | 0.543 | 0.655 | 0.458 |
| Assets: Expected Loss | 16.51 | 83.49 | 100 | 13.85 | 16.15 | 30 | 70 |
| Assets: Dist Ccoc | 10 | 90 | 100 | 10 | 20 | 30 | 70 |
| Assets: Dist PH | 9.42 | 90.58 | 100 | 9.67 | 20.33 | 30 | 70 |
| Assets: Dist Wang | 9.76 | 90.24 | 100 | 10.09 | 19.91 | 30 | 70 |
| Assets: Dist Dual | 9.87 | 90.13 | 100 | 10.4 | 19.6 | 30 | 70 |
| Assets: Dist Tvar | 10.35 | 89.65 | 100 | 10.92 | 19.08 | 30 | 70 |
| Assets: Dist Blend | 11.67 | 88.33 | 100 | 11.39 | 18.61 | 30 | 70 |
Figure W
PIR Chapter 15, Figure 15.11, Loss and loss spectrums.
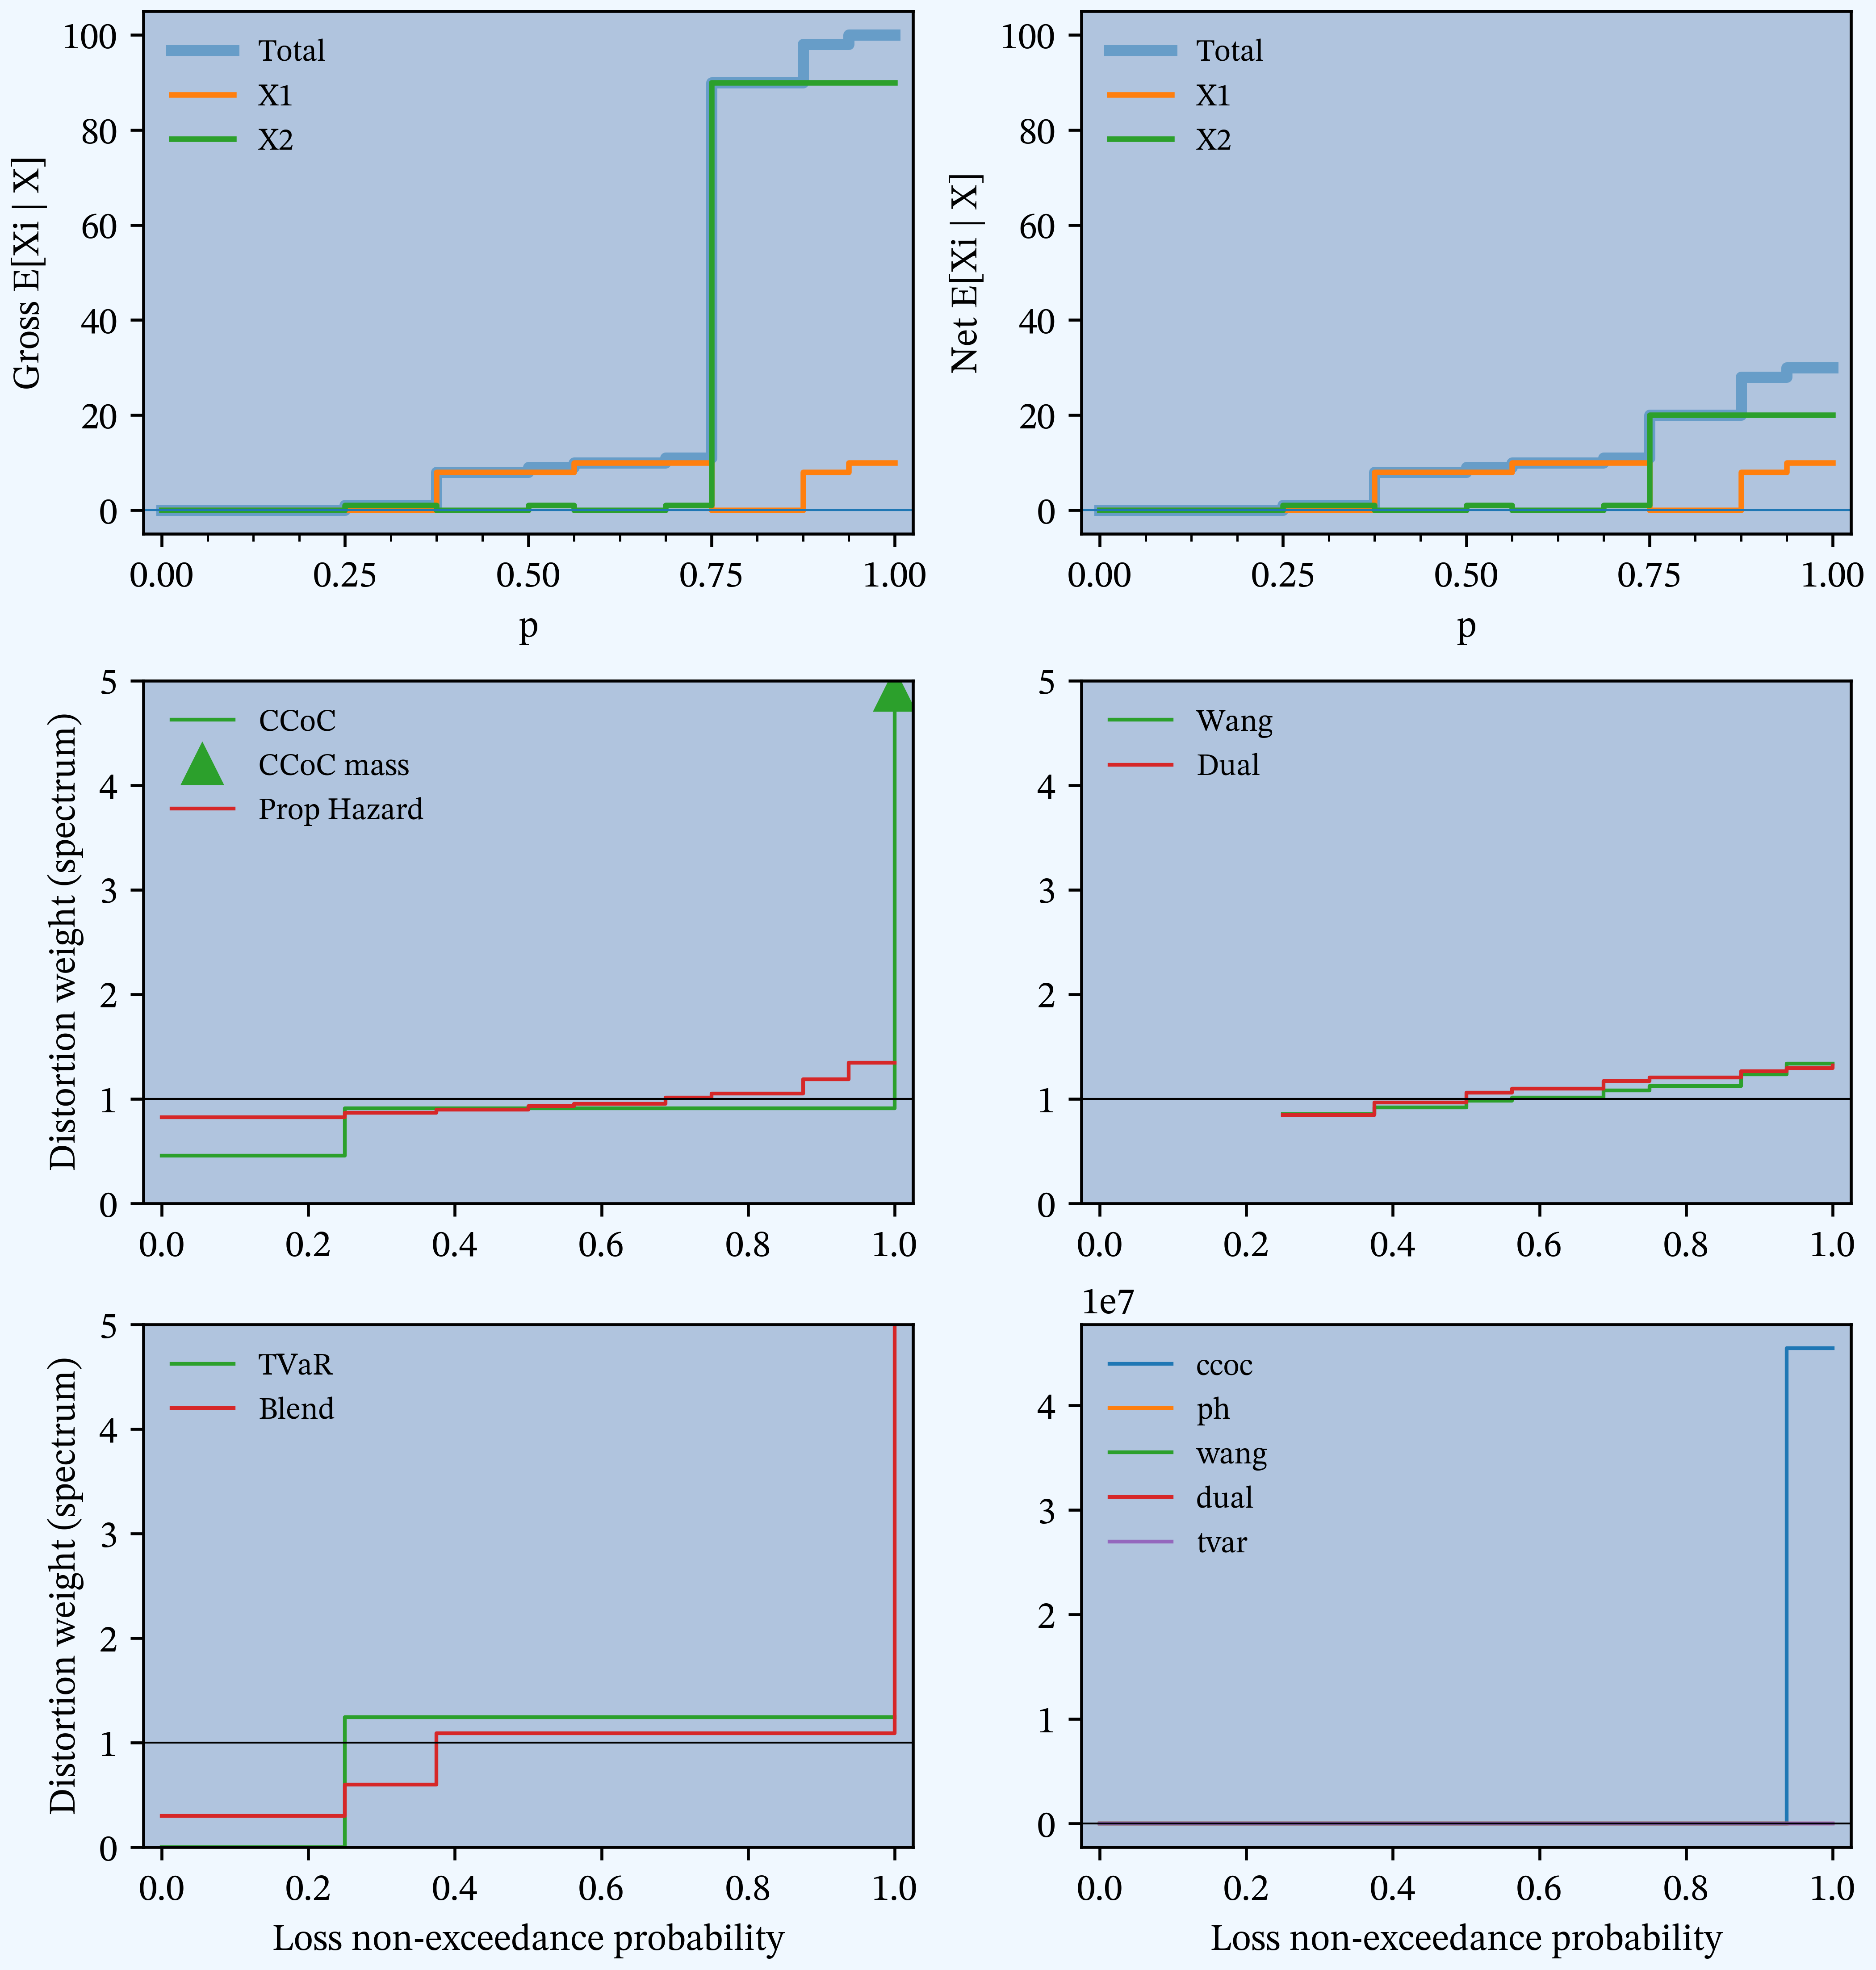
Figure X
PIR Chapter 15, Figures 15.12, 15.13, 15.14, Percentile layer of capital allocations by asset level.
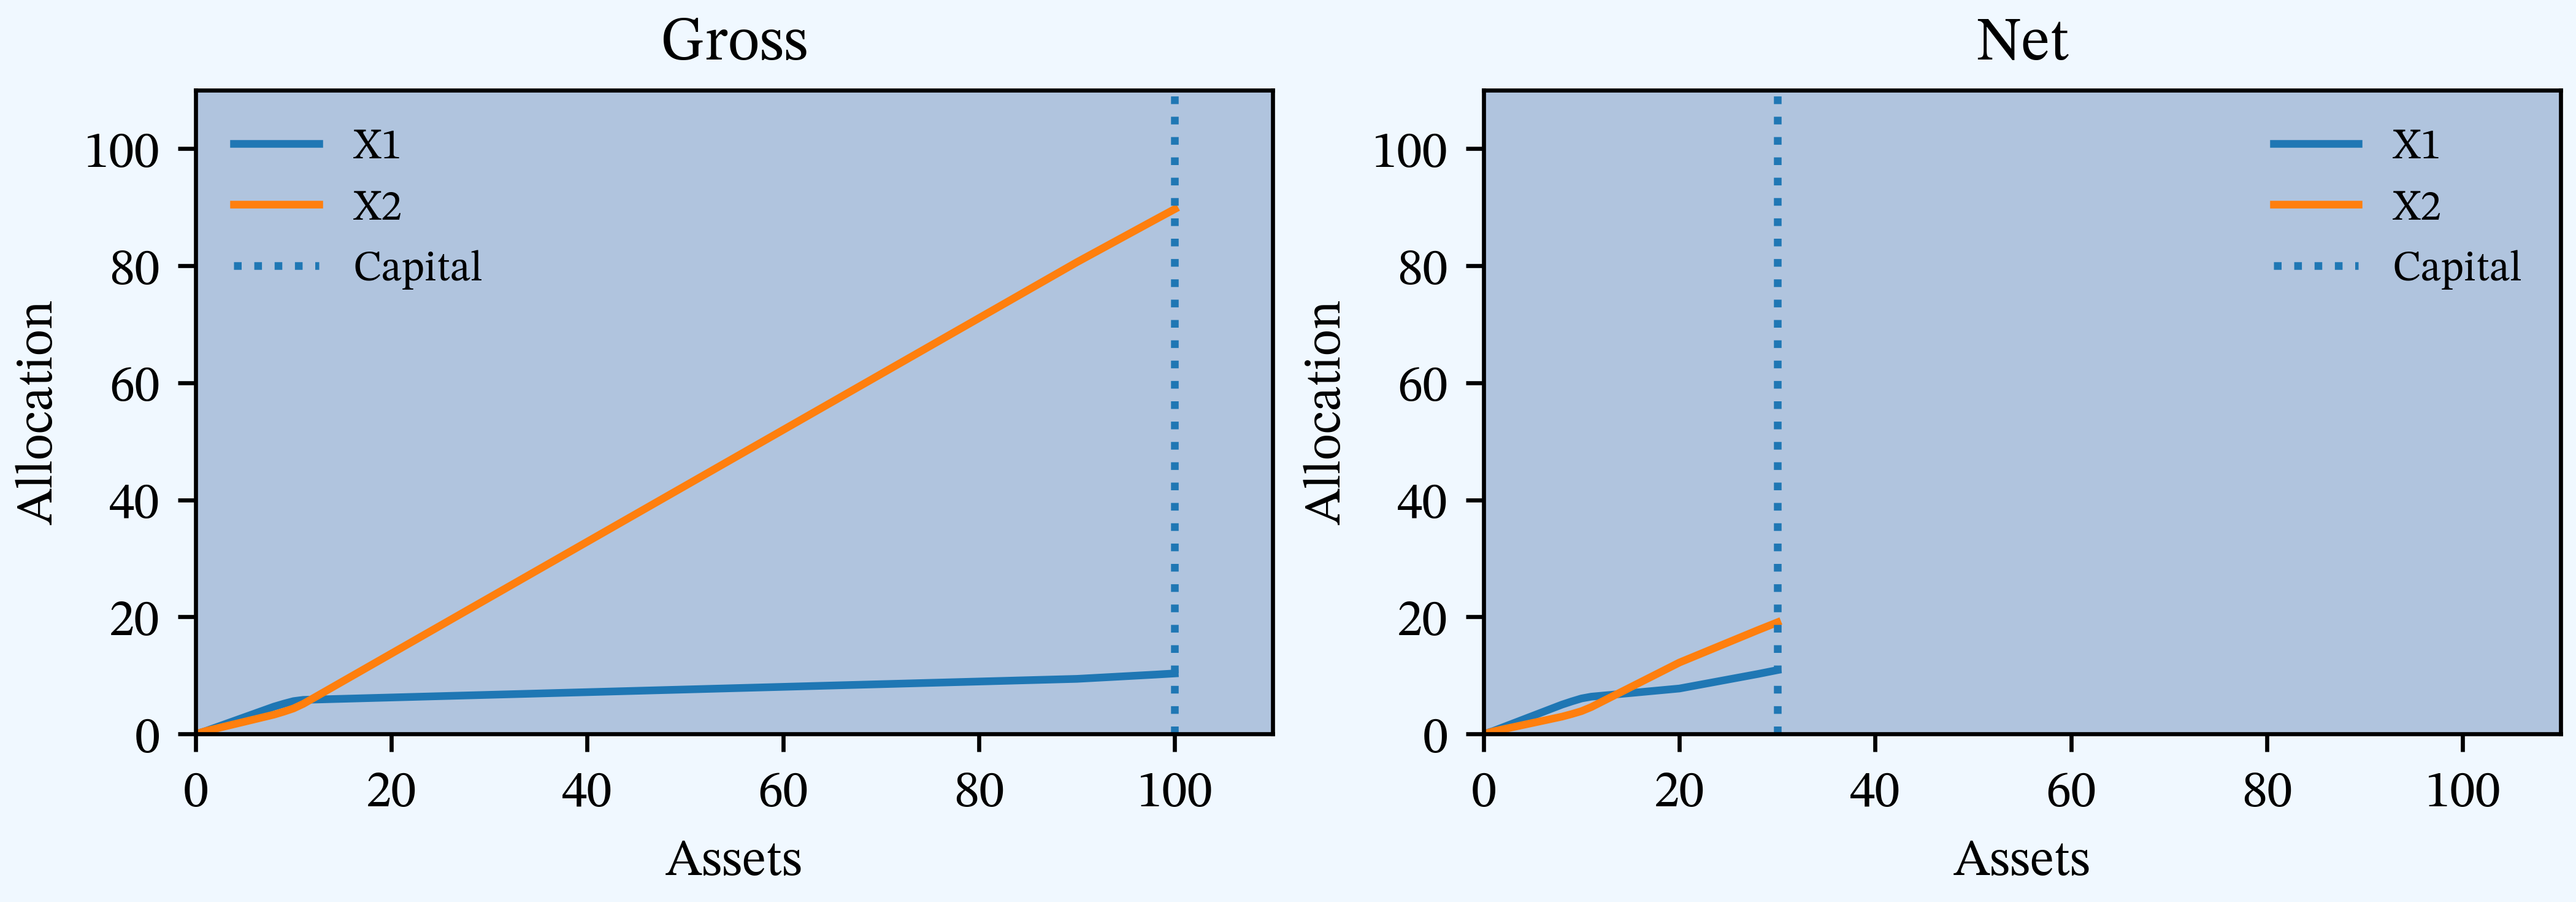
Table Y
PIR Chapter 15, Tables 15.38, 15.39, 15.40, Percentile layer of capital allocations compared to distortion allocations.
| Method | Gross: X1 | Gross: X2 | Gross: Total | Net: X1 | Net: X2 | Net: Total | Ceded: Diff |
|---|---|---|---|---|---|---|---|
| Expected Loss | 16.51 | 83.49 | 100 | 13.85 | 16.15 | 30 | 70 |
| Dist Ccoc | 10 | 90 | 100 | 10 | 20 | 30 | 70 |
| Dist PH | 9.416 | 90.58 | 100 | 9.668 | 20.33 | 30 | 70 |
| Dist Wang | 9.758 | 90.24 | 100 | 10.09 | 19.91 | 30 | 70 |
| Dist Dual | 9.87 | 90.13 | 100 | 10.4 | 19.6 | 30 | 70 |
| Dist Tvar | 10.35 | 89.65 | 100 | 10.92 | 19.08 | 30 | 70 |
| Dist Blend | 11.67 | 88.33 | 100 | 11.39 | 18.61 | 30 | 70 |
| PLC | 10.35 | 89.65 | 100 | 10.92 | 19.08 | 30 | 70 |
Discrete Case Description
PIR Discrete Case Study (no equal points).
Distributions
# Line A (usually thinner tailed)
agg X1 1 claim dsev [0 8 10] [1/2 1/4 1/4] fixed

# Line B Gross (usually thicker tailed)
agg X2 1 claim dsev [0 1 90] [1/2 1/4 1/4] fixed

# Line B Net
agg X2 1 claim dsev [0 1 90] [1/2 1/4 1/4] fixed aggregate net of 70 xs 20
Other Parameters
reg_p = 1roe = 0.1d2tc = 0.3s_values = [0.005, 0.01, 0.03]gs_values = [0.029126, 0.047619, 0.074074]f_discrete = Truelog2 = 8bs = 1padding = 1
Description of Tables and Figures
| Ref. | Kind | Chapter | Number(s) | Description |
|---|---|---|---|---|
| A | Table | 2 | 2.3, 2.5, 2.6, 2.7 | Estimated mean, CV, skewness and kurtosis by line and in total, gross and net. |
| B | Figure | 2 | 2.2, 2.4, 2.6 | Gross and net densities on a linear and log scale. |
| C | Figure | 2 | 2.3, 2.5, 2.7 | Bivariate densities: gross and net with gross sample. |
| D | Figure | 4 | 4.9, 4.10, 4.11, 4.12 | TVaR, and VaR for unlimited and limited variables, gross and net. |
| E | Table | 4 | 4.6, 4.7, 4.8 | Estimated VaR, TVaR, and EPD by line and in total, gross, and net. |
| F | Table | 7 | 7.2 | Pricing summary. |
| G | Table | 7 | 7.3 | Details of reinsurance. |
| H | Table | 9 | 9.2, 9.5, 9.8 | Classical pricing by method. |
| I | Table | 9 | 9.3, 9.6, 9.9 | Sum of parts (SoP) stand-alone vs. diversified classical pricing by method. |
| J | Table | 9 | 9.4, 9.7, 9.10 | Implied loss ratios from classical pricing by method. |
| K | Table | 9 | 9.11 | Comparison of stand-alone and sum of parts premium. |
| L | Table | 9 | 9.12, 9.13, 9.14 | Constant CoC pricing by unit for Case Study. |
| M | Figure | 11 | 11.2, 11.3, 11.4,11.5 | Distortion envelope for Case Study, gross. |
| N | Table | 11 | 11.5 | Parameters for the six SRMs and associated distortions. |
| O | Figure | 11 | 11.6, 11.7, 11.8 | Variation in insurance statistics for six distortions as \(s\) varies. |
| P | Figure | 11 | 11.9, 11.10, 11.11 | Variation in insurance statistics as the asset limit is varied. |
| Q | Table | 11 | 11.7, 11.8, 11.9 | Pricing by unit and distortion for Case Study. |
| R | Table | 13 | 13.1 missing | Comparison of gross expected losses by Case, catastrophe-prone lines. |
| S | Table | 13 | 13.2, 13.3, 13.4 | Constant 0.10 ROE pricing for Case Study, classical PCP methods. |
| T | Figure | 15 | 15.2 - 15.7 (G/N) | Twelve plot. |
| U | Figure | 15 | 15.8, 15.9, 15.10 | Capital density by layer. |
| V | Table | 15 | 15.35, 15.36, 15.37 | Constant 0.10 ROE pricing for Cat/Non-Cat Case Study, distortion, SRM methods. |
| W | Figure | 15 | 15.11 | Loss and loss spectrums. |
| X | Figure | 15 | 15.12, 15.13, 15.14 | Percentile layer of capital allocations by asset level. |
| Y | Table | 15 | 15.38, 15.39, 15.40 | Percentile layer of capital allocations compared to distortion allocations. |