Here are several things I always forget when using matplotlib. This post written with help from Gemini and ChatGPT4.0.
Plotting Arrays
import numpy as np
import pandas as pd
import matplotlib.pyplot as plt
x = np.linspace(-1, 1, 21)
y = np.linspace(-2, 2, 21)
X, Y = np.meshgrid(x, y)
Z = np.exp(-(X*X + Y*Y)**.5)
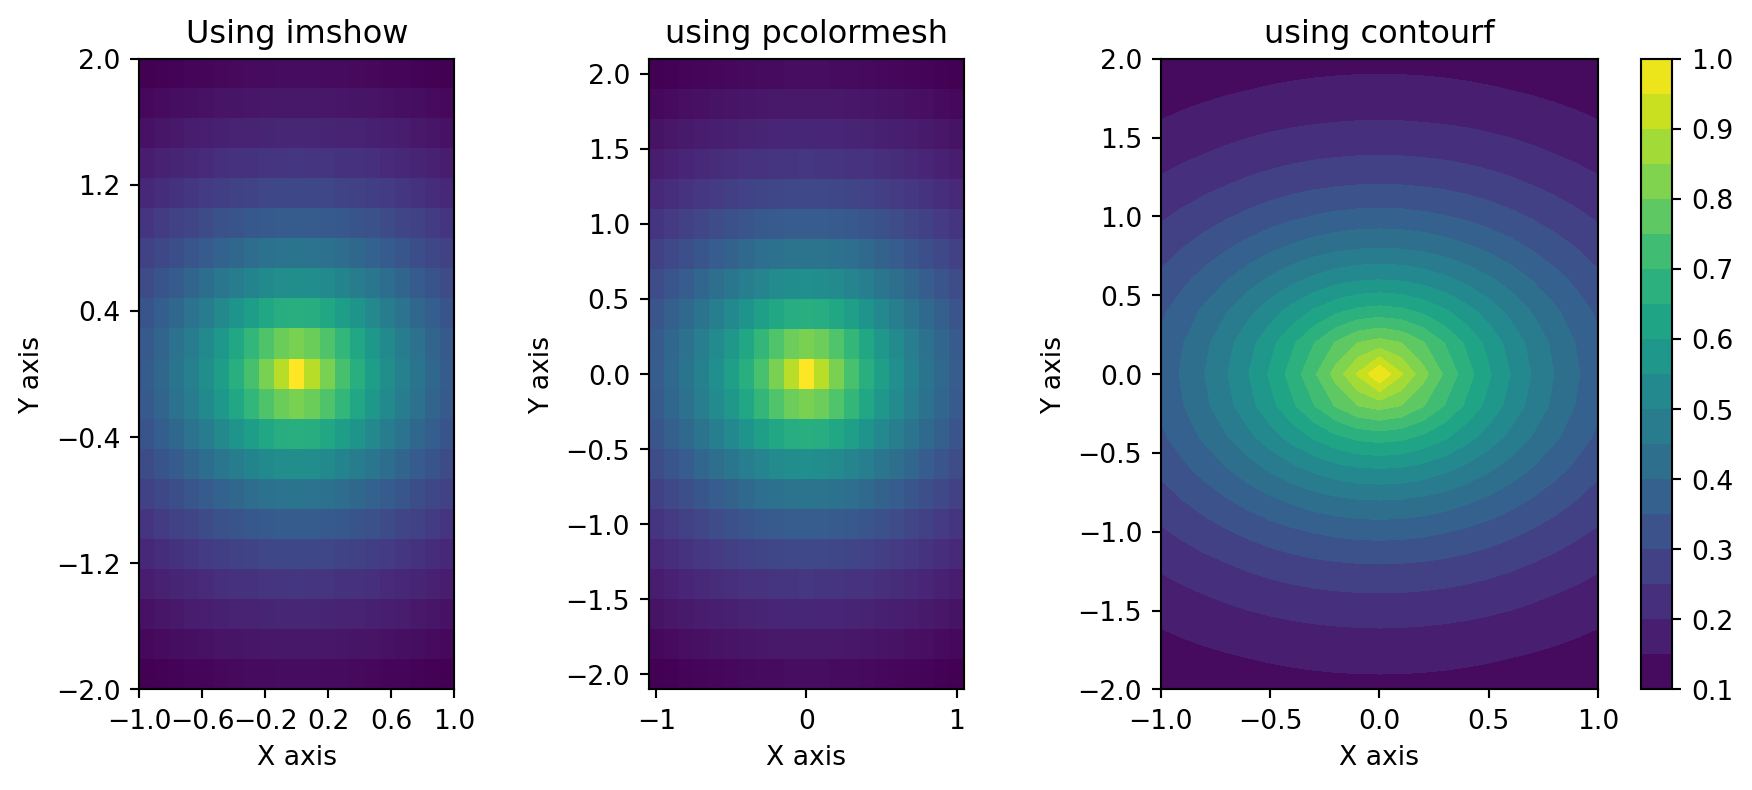
fig, axs = plt.subplots(1, 3, figsize=(9.0, 4.0), constrained_layout=True)
ax, ax1, ax2 = axs.flat
im = ax.imshow(Z, extent=[x.min(), x.max(), y.min(), y.max()],
origin='lower', aspect='equal')
ax.set(xlabel='X axis', ylabel='Y axis', xticks=x[::4], yticks=y[::4], title='Using imshow');
# fig.colorbar(im, ax=ax)
# Plot Z using pcolormesh
ax1.pcolormesh(x, y, Z, shading='auto')
ax1.set(aspect='equal', xlabel='X axis', ylabel='Y axis', title='using pcolormesh');
# Plot filled contours using contourf
contour_set = ax2.contourf(X, Y, Z, levels=20, cmap='viridis')
# Add colorbar for reference
fig.colorbar(contour_set, ax=ax2)
ax2.set(#aspect='equal',
xlabel='X axis', ylabel='Y axis', title='using contourf');