::: {.columns}
::: {.column width="45%"}
Col 1 Text (rest omitted)

:::
::: {.column width="10%"}
:::

::: {.column width="45%"}
Col 2 Text (rest omitted)

:::
:::
Output
Col 1 Text
Collects are a name given to ‘a comparatively short prayer, more or less condensed in form, and aiming at a single point, or at two points closely connected with each other’.
Col 2 Text
Collects are a name given to ‘a comparatively short prayer, more or less condensed in form, and aiming at a single point, or at two points closely connected with each other’.
Bootstrap layout
Input
::: {.grid}
::: {.g-col-4}

Left flex column. Left flex column. Left flex column. Left flex column.

:::
::: {.g-col-7 .px-4}

Right flex column. Right flex column. Right flex column. Right flex column.

:::
:::
Output
Left flex column. Can use the col-sm construction.
Right flex column. Can apply different padding and margins.
Footnotes
Input
Inline footnotes^[Here is the in-line footnote.]. Separate footnotes[^label].

[^label]: here is the text of the footnote.
::: {#tbl-panel layout-ncol=2}
| Col1 | Col2 | Col3 |
|------|------|------|
| A    | B    | C    |
| E    | F    | G    |
| A    | G    | G    |

: First Table {#tbl-first}

| Col1 | Col2 | Col3 |
|------|------|------|
| A    | B    | C    |
| E    | F    | G    |
| A    | G    | G    |

: Second Table {#tbl-second}

Main Caption
:::
Output
Table 1: Main Caption
(a) First Table
Col1
Col2
Col3
A
B
C
E
F
G
A
G
G
(b) Second Table
Col1
Col2
Col3
A
B
C
E
F
G
A
G
G
Environments
Available environments:thm, lem, cor, prp, def, exm, exr, sol, rem.
Input
::: {#thm-line}

### Line

The equation of any straight line, called a linear equation, can be written as:

$$
y = mx + b.
$$
:::


::: {.proof}
Euclid, *personal communication.*
:::
Output
Theorem 1 (Line) The equation of any straight line, called a linear equation, can be written as:
\[
y = mx + b.
\]
Proof. Euclid, personal communication.
Callouts
Input
:::{.callout-note}
Note that there are five types of callouts, including:
`note`, `tip`, `warning`, `caution`, and `important`.
:::
Output
Note
Note that there are five types of callouts, including: note, tip, warning, caution, and important.
#| label: fig-plots
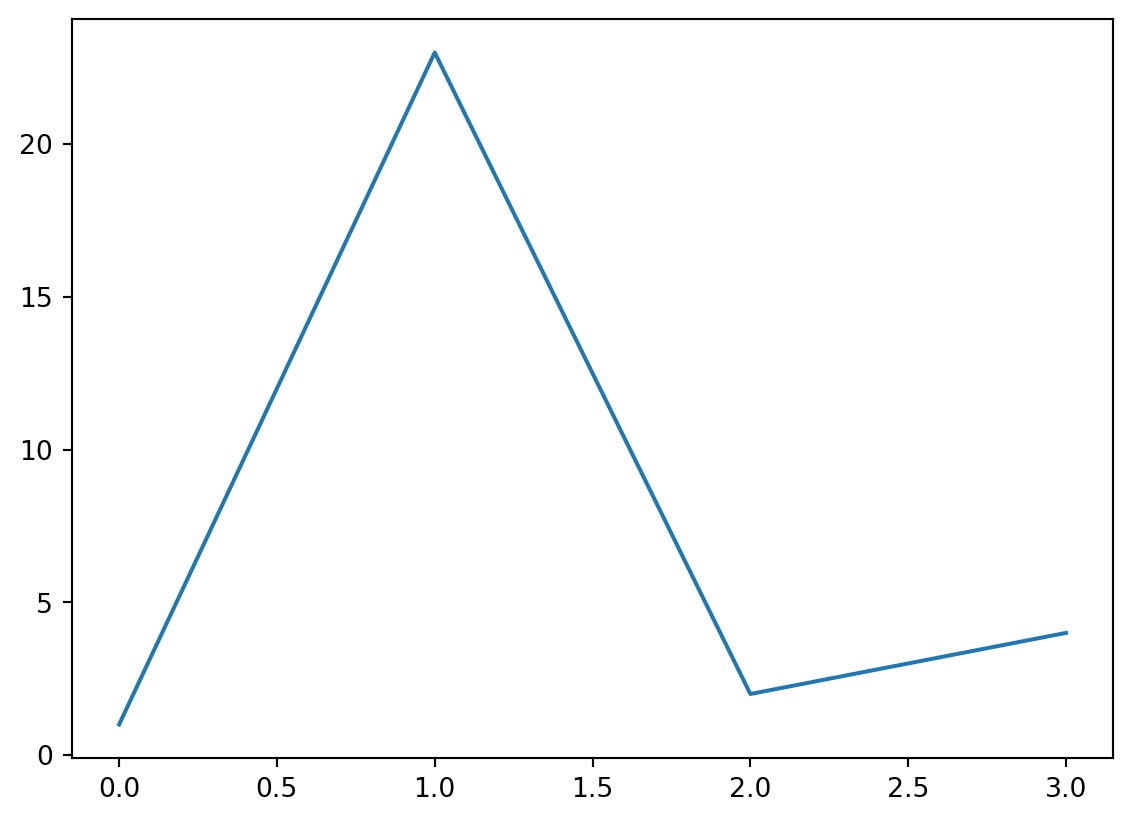
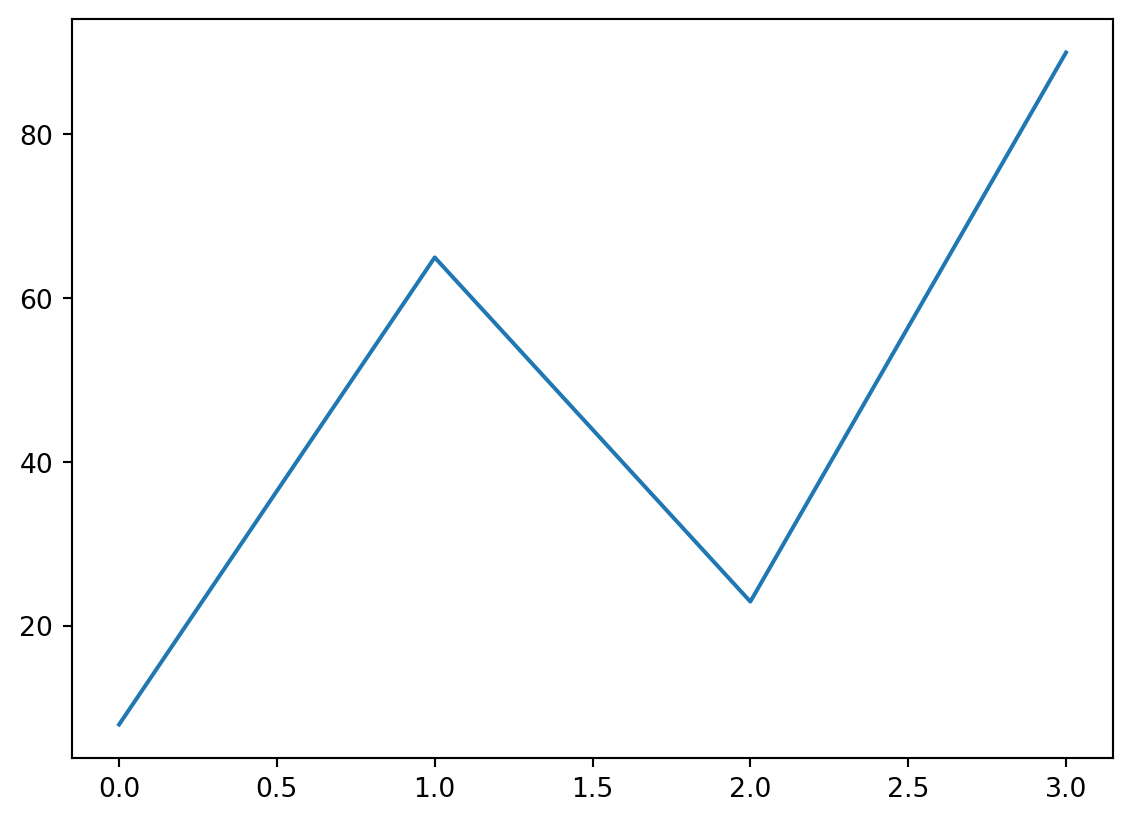
#| fig-cap: "Overall caption for code, and plots a and b."
#| fig-subcap:
#| - "Plot a heading"
#| - "Plot b heading"
#| layout-ncol: 3
#| lst-label: lst-code-block
#| lst-cap: Caption for listing to make a test dataframe and create some plots.
import matplotlib.pyplot as plt
plt.plot([1,23,2,4])
plt.show()
plt.plot([8,65,23,90])
plt.show()
Output
(a) Caption to make a test dataframe and create some plots.
import matplotlib.pyplot as pltplt.plot([1,23,2,4])plt.show()plt.plot([8,65,23,90])plt.show()
(b) Plot a heading.
(c) Plot b heading.
Figure 1: Overall caption for code, and plots a and b.
Folded code and displaying DataFrames
Input
With folded code.
#| code-fold: true
#| label: tbl-test
#| tbl-cap: Here is a test dataframe.
import pandas as pd
import numpy as np

# this comment remains
df = pd.DataFrame({'x': np.linspace(0,10,21)})
df['y'] = 2. + 3.* df.x
df['z'] = df.x ** 1.3

df.iloc[::4]
Output
Code
import pandas as pdimport numpy as np# this comment remainsdf = pd.DataFrame({'x': np.linspace(0,10,21)})df['y'] =2.+3.* df.xdf['z'] = df.x **1.3df.iloc[::4]
Table 2: Here is a test dataframe.
x
y
z
0
0.0
2.0
0.000000
4
2.0
8.0
2.462289
8
4.0
14.0
6.062866
12
6.0
20.0
10.270619
16
8.0
26.0
14.928528
20
10.0
32.0
19.952623
Using itables.show
Input
#| lst-label: lst-code-block-2
#| lst-cap: Listing showing use of itables show.
from itables import show
df = pd.concat([df for i in range(5)])
show(df, caption='My datatable.',
    classes="display nowrap compact",
    lengthMenu=[25, 50, 100, -1])
Output
Listing 1: Listing showing use of itables show.
from itables import showdf = pd.concat([df for i inrange(5)])show(df, caption='My datatable.', classes="display nowrap compact", lengthMenu=[25, 50, 100, -1])